West Europe population
0
Births this year: 0
Births today 0
Deaths this year 0
Deaths today 0
0
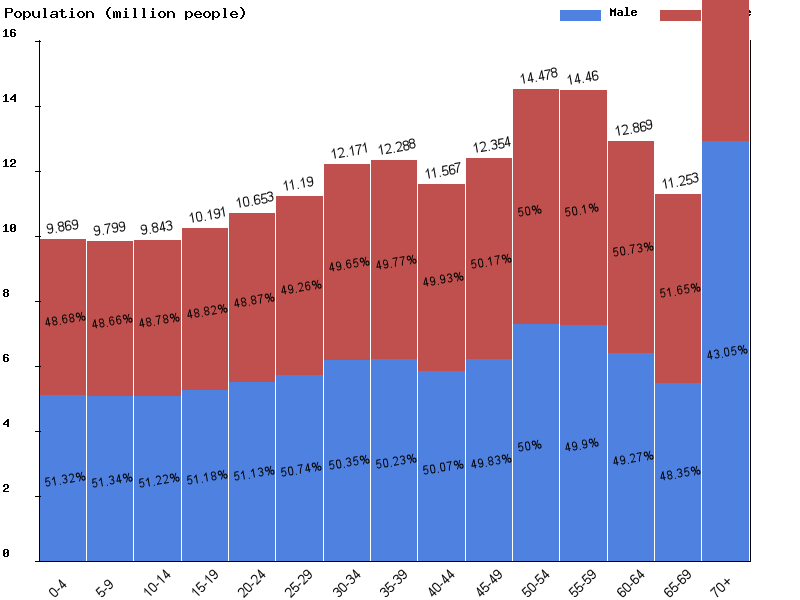
| Age | Both Sexes Population | Male Population | Female Population | Both Sexes (%) | Male (%) | Female (%) | Sex ratio (female/male) |
|---|---|---|---|---|---|---|---|
| Total | 194,548,743 | 95,802,003 | 98,746,740 | 100 | 100 | 100 | 97 |
| 00-04 | 9,846,802 | 5,051,505 | 4,795,297 | 5.1 | 5.3 | 4.9 | 105.3 |
| 05-09 | 9,943,508 | 5,102,614 | 4,840,894 | 5.1 | 5.3 | 4.9 | 105.4 |
| 10-14 | 9,846,278 | 5,054,465 | 4,791,813 | 5.1 | 5.3 | 4.9 | 105.5 |
| 15-19 | 9,962,495 | 5,101,077 | 4,861,418 | 5.1 | 5.3 | 4.9 | 104.9 |
| 20-24 | 10,449,339 | 5,341,341 | 5,107,998 | 5.4 | 5.6 | 5.2 | 104.6 |
| 25-29 | 10,962,648 | 5,597,726 | 5,364,922 | 5.6 | 5.8 | 5.4 | 104.3 |
| 30-34 | 11,442,653 | 5,800,060 | 5,642,593 | 5.9 | 6.1 | 5.7 | 102.8 |
| 35-39 | 12,327,763 | 6,201,699 | 6,126,064 | 6.3 | 6.5 | 6.2 | 101.2 |
| 40-44 | 12,355,081 | 6,199,210 | 6,155,871 | 6.4 | 6.5 | 6.2 | 100.7 |
| 45-49 | 11,561,962 | 5,779,635 | 5,782,327 | 5.9 | 6 | 5.9 | 100 |
| 50-54 | 12,255,558 | 6,088,418 | 6,167,140 | 6.3 | 6.4 | 6.2 | 98.7 |
| 55-59 | 14,241,250 | 7,085,212 | 7,156,038 | 7.3 | 7.4 | 7.2 | 99 |
| 60-64 | 14,086,897 | 6,974,095 | 7,112,802 | 7.2 | 7.3 | 7.2 | 98 |
| 65-69 | 12,376,460 | 6,024,407 | 6,352,053 | 6.4 | 6.3 | 6.4 | 94.8 |
| 70-74 | 10,593,004 | 5,024,434 | 5,568,570 | 5.4 | 5.2 | 5.6 | 90.2 |
| 75-79 | 8,857,200 | 4,071,551 | 4,785,649 | 4.6 | 4.2 | 4.8 | 85.1 |
| 80-84 | 6,397,878 | 2,777,114 | 3,620,764 | 3.3 | 2.9 | 3.7 | 76.7 |
| 85-89 | 4,484,314 | 1,744,788 | 2,739,526 | 2.3 | 1.8 | 2.8 | 63.7 |
| 90-94 | 1,915,901 | 628,187 | 1,287,714 | 1 | 0.7 | 1.3 | 48.8 |
| 95-99 | 558,852 | 139,849 | 419,003 | 0.3 | 0.1 | 0.4 | 33.4 |
| 100+ | 82,900 | 14,616 | 68,284 | 0 | 0 | 0.1 | 21.4 |

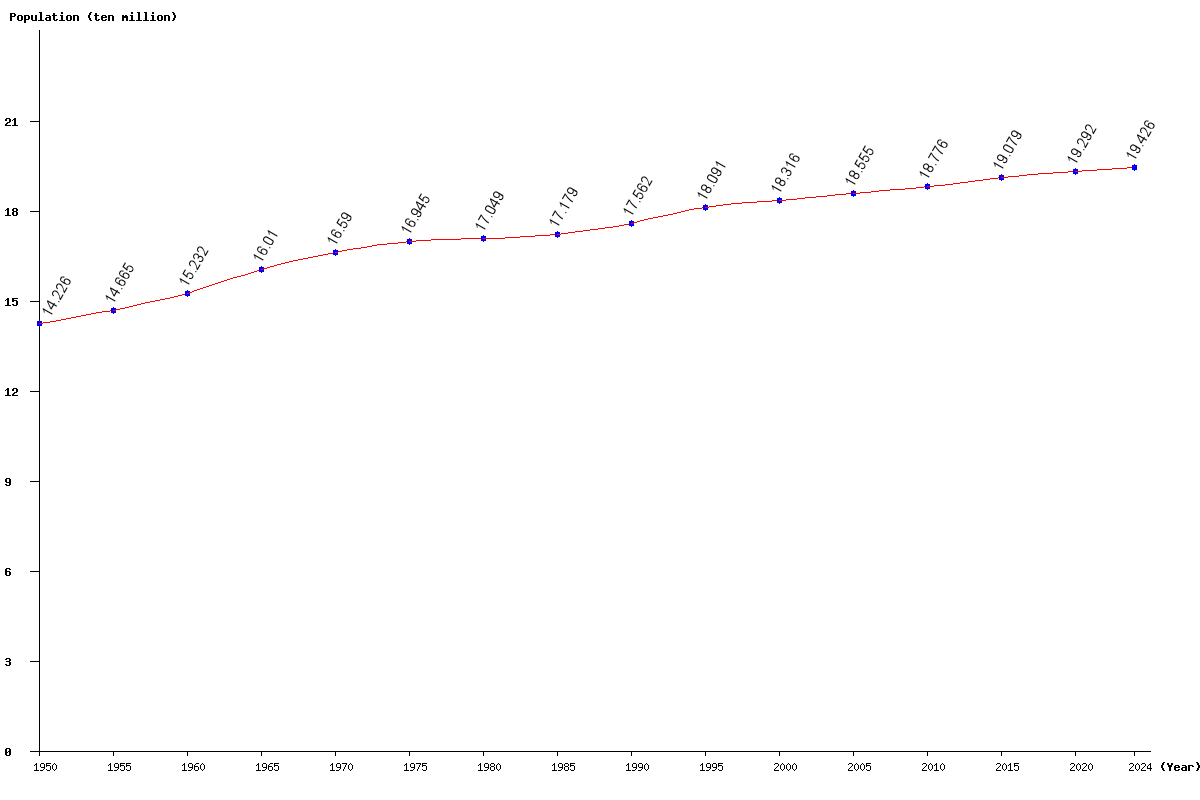
| Year | Population | Yearly % Change |
Yearly Change |
Sex ratio | Density (P/Km²) |
|---|---|---|---|---|---|
| 2024 | 194,257,829 | 0.16 | 308,202 | 96.97 | 179.07 |
| 2023 | 193,949,627 | 0.17 | 325,176 | 96.91 | 178.79 |
| 2022 | 193,624,451 | 0.18 | 341,742 | 96.85 | 178.49 |
| 2021 | 193,282,709 | 0.19 | 358,708 | 96.79 | 178.17 |
| 2020 | 192,924,001 | 0.19 | 370,882 | 96.71 | 177.84 |
| 2019 | 192,553,119 | 0.20 | 384,246 | 96.63 | 177.50 |
| 2018 | 192,168,873 | 0.21 | 410,740 | 96.54 | 177.15 |
| 2017 | 191,758,133 | 0.24 | 455,004 | 96.45 | 176.77 |
| 2016 | 191,303,129 | 0.27 | 509,497 | 96.36 | 176.35 |
| 2015 | 190,793,632 | 0.30 | 571,998 | 96.26 | 175.88 |
| 2014 | 190,221,634 | 0.33 | 623,831 | 96.18 | 175.35 |
| 2013 | 189,597,803 | 0.34 | 644,435 | 96.09 | 174.78 |
| 2012 | 188,953,368 | 0.33 | 622,181 | 96.01 | 174.18 |
| 2011 | 188,331,187 | 0.30 | 569,665 | 95.94 | 173.61 |
| 2010 | 187,761,522 | 0.27 | 504,085 | 95.89 | 173.09 |
| 2005 | 185,551,556 | 1.30 | 2,388,117 | 95.85 | 171.05 |
| 2000 | 183,163,439 | 1.25 | 2,254,215 | 95.82 | 168.85 |
| 1995 | 180,909,224 | 3.01 | 5,293,847 | 95.61 | 166.77 |
| 1990 | 175,615,377 | 2.22 | 3,821,182 | 94.87 | 161.89 |
| 1985 | 171,794,195 | 0.77 | 1,304,882 | 94.05 | 158.37 |
| 1980 | 170,489,313 | 0.62 | 1,044,253 | 93.91 | 157.16 |
| 1975 | 169,445,060 | 2.13 | 3,541,899 | 93.60 | 156.20 |
| 1970 | 165,903,161 | 3.62 | 5,802,894 | 93.10 | 152.94 |
| 1965 | 160,100,267 | 5.11 | 7,780,499 | 92.29 | 147.59 |
| 1960 | 152,319,768 | 3.86 | 5,666,495 | 90.90 | 140.41 |
| 1955 | 146,653,273 | 3.09 | 4,397,593 | 90.30 | 135.19 |
| 1950 | 142,255,680 | 89.58 | 131.14 |