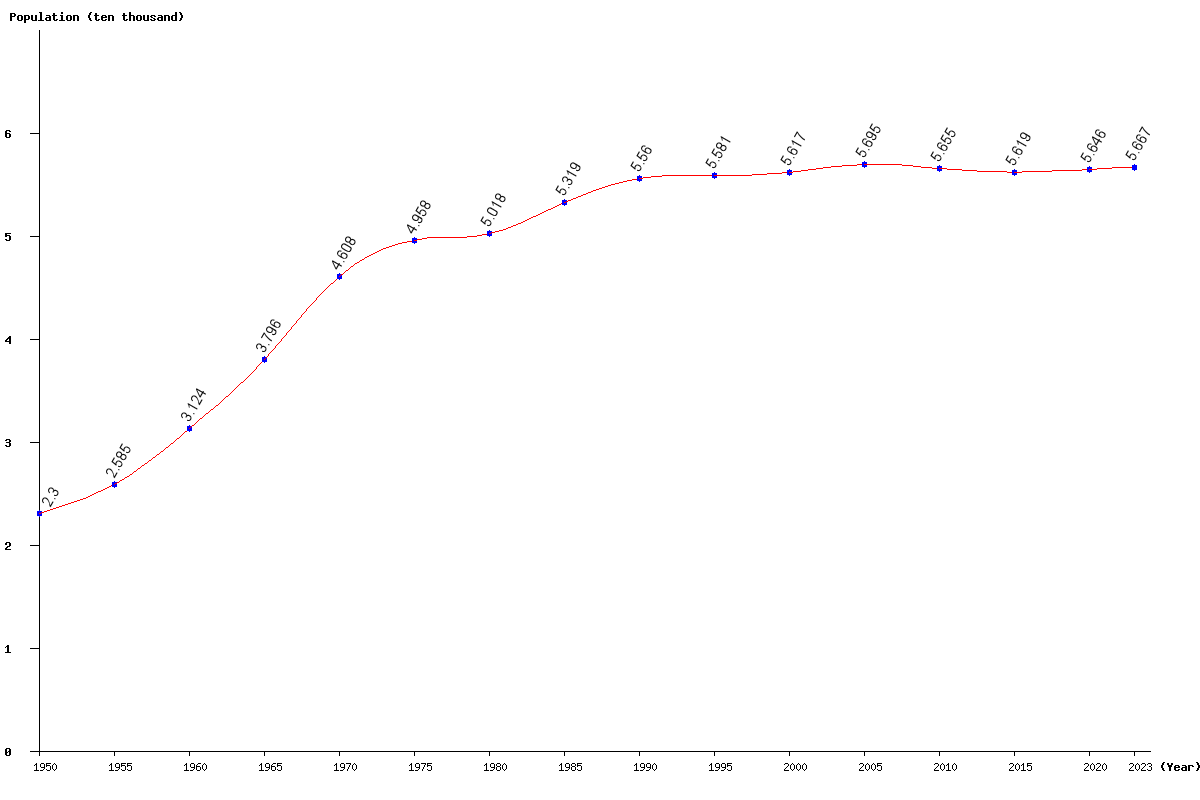
Greenland population
60,904
Births this year: 7,885
Births today 1
Deaths this year 4,709
Deaths today 0
60,904
| Region Name | Percents | Number |
|---|---|---|
| Evangelical Lutheran, traditional Inuit spiritual beliefs | 100% | 57,728 people |
| Ethnic groups Name | Percents | Number |
|---|---|---|
| Inuit | 89% | 51,378 people |
| Danish and other | 11% | 6,350 people |
| Year | Population | Yearly % Change |
Yearly Change |
Sex ratio | Density (P/Km²) |
|---|---|---|---|---|---|
| 2024 | 56,713 | 0.08 | 46 | 85.11 | 0.14 |
| 2023 | 56,667 | 0.11 | 63 | 85.05 | 0.14 |
| 2022 | 56,604 | 0.13 | 71 | 85.00 | 0.14 |
| 2021 | 56,533 | 0.13 | 75 | 84.97 | 0.14 |
| 2020 | 56,458 | 0.14 | 77 | 84.97 | 0.14 |
| 2019 | 56,381 | 0.14 | 77 | 85.02 | 0.14 |
| 2018 | 56,304 | 0.12 | 65 | 85.09 | 0.14 |
| 2017 | 56,239 | 0.08 | 43 | 85.18 | 0.14 |
| 2016 | 56,196 | 0.02 | 10 | 85.26 | 0.14 |
| 2015 | 56,186 | -0.04 | -25 | 85.33 | 0.14 |
| 2014 | 56,211 | -0.10 | -54 | 85.35 | 0.14 |
| 2013 | 56,265 | -0.14 | -79 | 85.35 | 0.14 |
| 2012 | 56,344 | -0.17 | -97 | 85.37 | 0.14 |
| 2011 | 56,441 | -0.19 | -105 | 85.43 | 0.14 |
| 2010 | 56,546 | -0.21 | -117 | 85.57 | 0.14 |
| 2005 | 56,953 | 1.39 | 779 | 87.03 | 0.14 |
| 2000 | 56,174 | 0.65 | 365 | 87.97 | 0.14 |
| 1995 | 55,809 | 0.37 | 206 | 89.11 | 0.14 |
| 1990 | 55,603 | 4.54 | 2,414 | 89.83 | 0.14 |
| 1985 | 53,189 | 6.00 | 3,013 | 89.46 | 0.13 |
| 1980 | 50,176 | 1.20 | 594 | 89.17 | 0.12 |
| 1975 | 49,582 | 7.61 | 3,507 | 88.92 | 0.12 |
| 1970 | 46,075 | 21.37 | 8,112 | 88.35 | 0.11 |
| 1965 | 37,963 | 21.53 | 6,725 | 87.23 | 0.09 |
| 1960 | 31,238 | 20.87 | 5,393 | 85.53 | 0.08 |
| 1955 | 25,845 | 12.38 | 2,847 | 83.97 | 0.06 |
| 1950 | 22,998 | 82.16 | 0.06 |
