West Asia population
0
Births this year: 0
Births today 0
Deaths this year 0
Deaths today 0
0
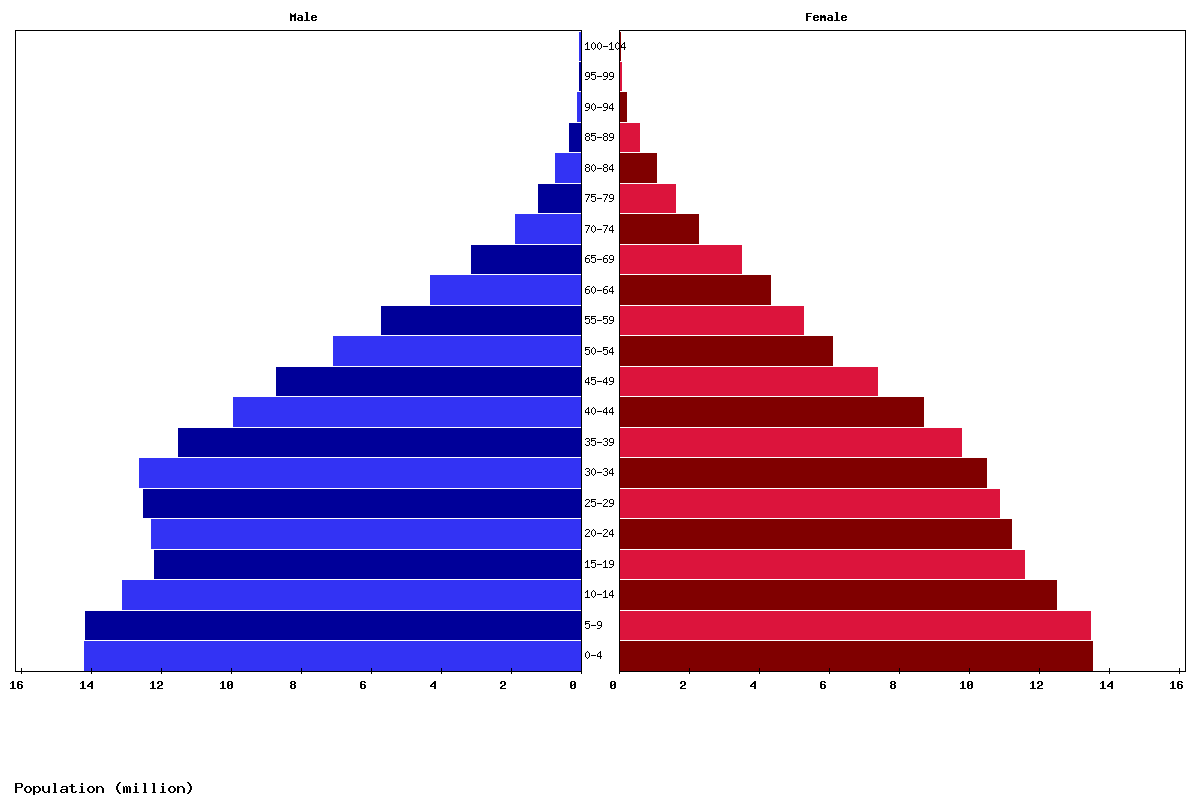
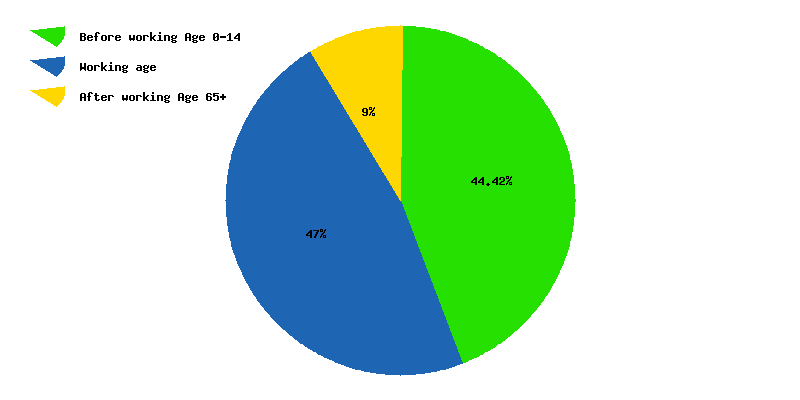
| Age | Both Sexes Population | Male Population | Female Population | Both Sexes (%) | Male (%) | Female (%) | Sex ratio (female/male) |
|---|---|---|---|---|---|---|---|
| Total | 300,747,033 | 155,868,388 | 144,878,645 | 100 | 100 | 100 | 107.6 |
| 00-04 | 27,962,994 | 14,327,779 | 13,635,215 | 9.3 | 9.2 | 9.4 | 105.1 |
| 05-09 | 27,826,959 | 14,255,878 | 13,571,081 | 9.3 | 9.1 | 9.4 | 105 |
| 10-14 | 27,445,831 | 14,065,751 | 13,380,080 | 9.1 | 9 | 9.2 | 105.1 |
| 15-19 | 25,365,689 | 13,020,882 | 12,344,807 | 8.4 | 8.4 | 8.5 | 105.5 |
| 20-24 | 24,011,806 | 12,533,300 | 11,478,506 | 8 | 8 | 7.9 | 109.2 |
| 25-29 | 24,280,689 | 12,984,505 | 11,296,184 | 8.1 | 8.3 | 7.8 | 114.9 |
| 30-34 | 23,758,094 | 12,780,941 | 10,977,153 | 7.9 | 8.2 | 7.6 | 116.4 |
| 35-39 | 22,804,331 | 12,270,838 | 10,533,493 | 7.6 | 7.9 | 7.3 | 116.5 |
| 40-44 | 20,694,850 | 10,974,033 | 9,720,817 | 6.9 | 7 | 6.7 | 112.9 |
| 45-49 | 17,909,806 | 9,338,895 | 8,570,911 | 6 | 6 | 5.9 | 109 |
| 50-54 | 15,379,659 | 8,162,940 | 7,216,719 | 5.1 | 5.2 | 5 | 113.1 |
| 55-59 | 12,592,523 | 6,684,578 | 5,907,945 | 4.2 | 4.3 | 4.1 | 113.1 |
| 60-64 | 10,368,854 | 5,308,854 | 5,060,000 | 3.4 | 3.4 | 3.5 | 104.9 |
| 65-69 | 7,895,878 | 3,852,143 | 4,043,735 | 2.6 | 2.5 | 2.8 | 95.3 |
| 70-74 | 5,794,075 | 2,644,903 | 3,149,172 | 1.9 | 1.7 | 2.2 | 84 |
| 75-79 | 3,323,670 | 1,430,083 | 1,893,587 | 1.1 | 0.9 | 1.3 | 75.5 |
| 80-84 | 1,933,833 | 764,413 | 1,169,420 | 0.6 | 0.5 | 0.8 | 65.4 |
| 85-89 | 985,130 | 349,011 | 636,119 | 0.3 | 0.2 | 0.4 | 54.9 |
| 90-94 | 338,583 | 100,572 | 238,011 | 0.1 | 0.1 | 0.2 | 42.3 |
| 95-99 | 65,950 | 16,060 | 49,890 | 0 | 0 | 0 | 32.2 |
| 100+ | 7,829 | 2,029 | 5,800 | 0 | 0 | 0 | 35 |


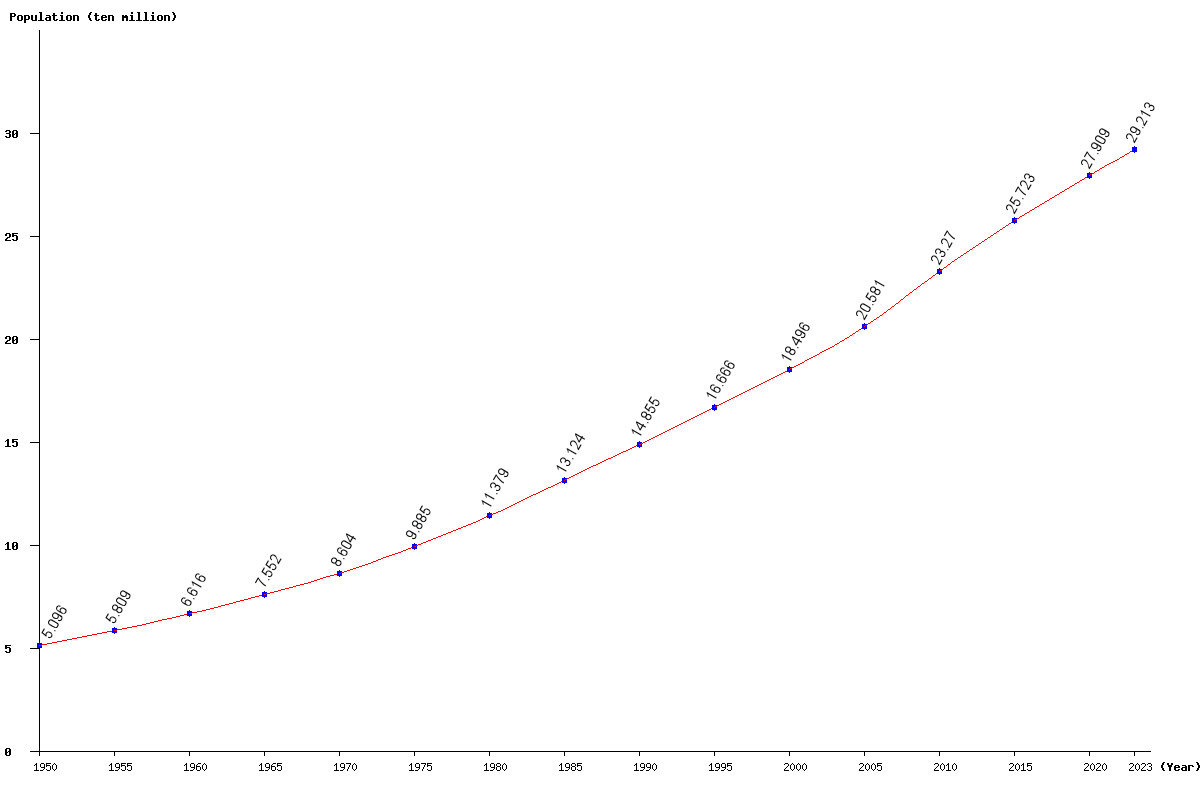
| Year | Population | Yearly % Change |
Yearly Change |
Sex ratio | Density (P/Km²) |
|---|---|---|---|---|---|
| 2025 | 300,747,033 | 1.45 | 4,287,996 | 107.59 | 62.59 |
| 2024 | 296,459,037 | 1.48 | 4,329,975 | 107.73 | 61.70 |
| 2023 | 292,129,062 | 1.51 | 4,352,804 | 107.87 | 60.80 |
| 2022 | 287,776,258 | 1.53 | 4,349,925 | 108.02 | 59.89 |
| 2021 | 283,426,333 | 1.55 | 4,332,150 | 108.17 | 58.98 |
| 2020 | 279,094,183 | 1.57 | 4,305,680 | 108.33 | 58.08 |
| 2019 | 274,788,503 | 1.59 | 4,294,919 | 108.49 | 57.19 |
| 2018 | 270,493,584 | 1.62 | 4,323,911 | 108.66 | 56.29 |
| 2017 | 266,169,673 | 1.68 | 4,407,442 | 108.81 | 55.39 |
| 2016 | 261,762,231 | 1.76 | 4,531,211 | 108.94 | 54.48 |
| 2015 | 257,231,020 | 1.84 | 4,647,839 | 109.02 | 53.53 |
| 2014 | 252,583,181 | 1.92 | 4,751,973 | 109.07 | 52.57 |
| 2013 | 247,831,208 | 2.01 | 4,881,208 | 109.06 | 51.58 |
| 2012 | 242,950,000 | 2.12 | 5,040,259 | 108.98 | 50.56 |
| 2011 | 237,909,741 | 2.24 | 5,207,021 | 108.80 | 49.51 |
| 2010 | 232,702,720 | 2.37 | 5,396,295 | 108.50 | 48.43 |
| 2005 | 205,806,355 | 11.27 | 20,849,530 | 105.49 | 42.83 |
| 2000 | 184,956,825 | 10.98 | 18,301,162 | 103.66 | 38.49 |
| 1995 | 166,655,663 | 12.19 | 18,103,734 | 103.91 | 34.68 |
| 1990 | 148,551,929 | 13.19 | 17,314,696 | 103.11 | 30.92 |
| 1985 | 131,237,233 | 15.34 | 17,451,458 | 102.22 | 27.31 |
| 1980 | 113,785,775 | 15.11 | 14,936,637 | 101.59 | 23.68 |
| 1975 | 98,849,138 | 14.89 | 12,811,644 | 100.44 | 20.57 |
| 1970 | 86,037,494 | 13.92 | 10,513,110 | 99.68 | 17.91 |
| 1965 | 75,524,384 | 14.16 | 9,368,765 | 99.53 | 15.72 |
| 1960 | 66,155,619 | 13.89 | 8,067,218 | 99.26 | 13.77 |
| 1955 | 58,088,401 | 13.99 | 7,130,961 | 99.33 | 12.09 |
| 1950 | 50,957,440 | 99.86 | 10.60 |
