West Africa population
0
Births this year: 0
Births today 0
Deaths this year 0
Deaths today 0
0
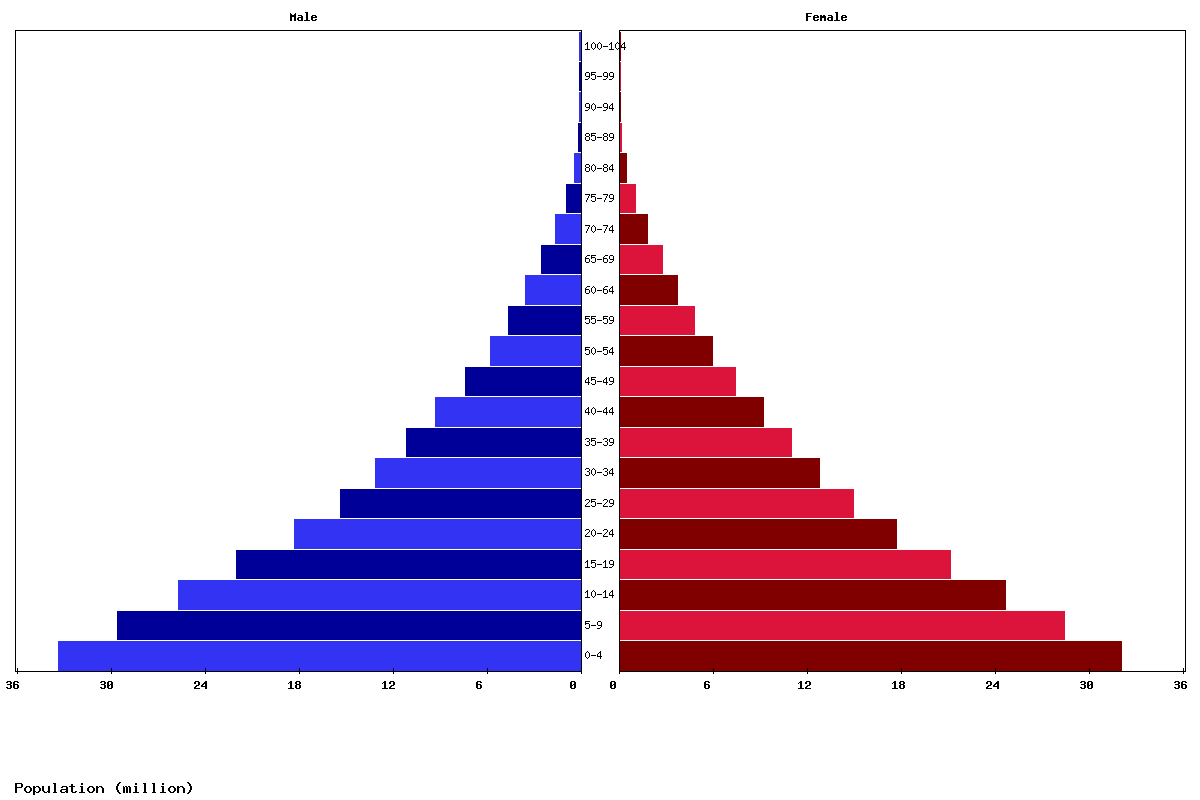
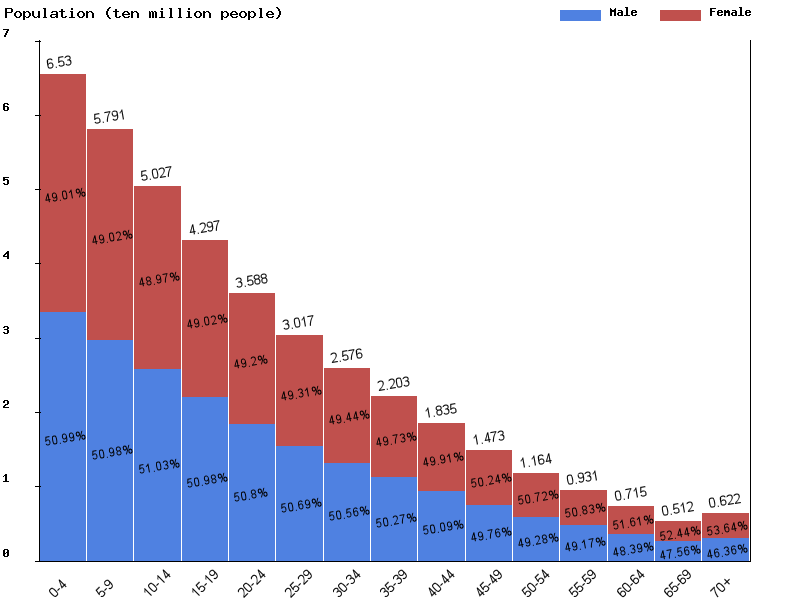
| Age | Both Sexes Population | Male Population | Female Population | Both Sexes (%) | Male (%) | Female (%) | Sex ratio (female/male) |
|---|---|---|---|---|---|---|---|
| Total | 457,070,899 | 231,243,172 | 225,827,727 | 100 | 100 | 100 | 102.4 |
| 00-04 | 70,994,706 | 36,235,082 | 34,759,624 | 15.5 | 15.7 | 15.4 | 104.2 |
| 05-09 | 63,366,050 | 32,322,915 | 31,043,135 | 13.9 | 14 | 13.7 | 104.1 |
| 10-14 | 57,006,901 | 29,106,277 | 27,900,624 | 12.5 | 12.6 | 12.4 | 104.3 |
| 15-19 | 49,478,993 | 25,236,618 | 24,242,375 | 10.8 | 10.9 | 10.7 | 104.1 |
| 20-24 | 41,896,903 | 21,307,012 | 20,589,891 | 9.2 | 9.2 | 9.1 | 103.5 |
| 25-29 | 34,851,155 | 17,685,906 | 17,165,249 | 7.6 | 7.6 | 7.6 | 103 |
| 30-34 | 29,282,180 | 14,843,374 | 14,438,806 | 6.4 | 6.4 | 6.4 | 102.8 |
| 35-39 | 24,924,677 | 12,587,548 | 12,337,129 | 5.5 | 5.4 | 5.5 | 102 |
| 40-44 | 21,241,928 | 10,653,951 | 10,587,977 | 4.6 | 4.6 | 4.7 | 100.6 |
| 45-49 | 17,594,417 | 8,772,288 | 8,822,129 | 3.8 | 3.8 | 3.9 | 99.4 |
| 50-54 | 13,971,586 | 6,903,907 | 7,067,679 | 3.1 | 3 | 3.1 | 97.7 |
| 55-59 | 10,834,840 | 5,288,722 | 5,546,118 | 2.4 | 2.3 | 2.5 | 95.4 |
| 60-64 | 8,367,213 | 4,067,279 | 4,299,934 | 1.8 | 1.8 | 1.9 | 94.6 |
| 65-69 | 6,046,635 | 2,890,491 | 3,156,144 | 1.3 | 1.2 | 1.4 | 91.6 |
| 70-74 | 3,900,910 | 1,830,514 | 2,070,396 | 0.9 | 0.8 | 0.9 | 88.4 |
| 75-79 | 2,149,503 | 996,199 | 1,153,304 | 0.5 | 0.4 | 0.5 | 86.4 |
| 80-84 | 890,236 | 400,646 | 489,590 | 0.2 | 0.2 | 0.2 | 81.8 |
| 85-89 | 233,762 | 99,631 | 134,131 | 0.1 | 0 | 0.1 | 74.3 |
| 90-94 | 35,160 | 13,724 | 21,436 | 0 | 0 | 0 | 64 |
| 95-99 | 2,977 | 1,034 | 1,943 | 0 | 0 | 0 | 53.2 |
| 100+ | 167 | 54 | 113 | 0 | 0 | 0 | 47.8 |
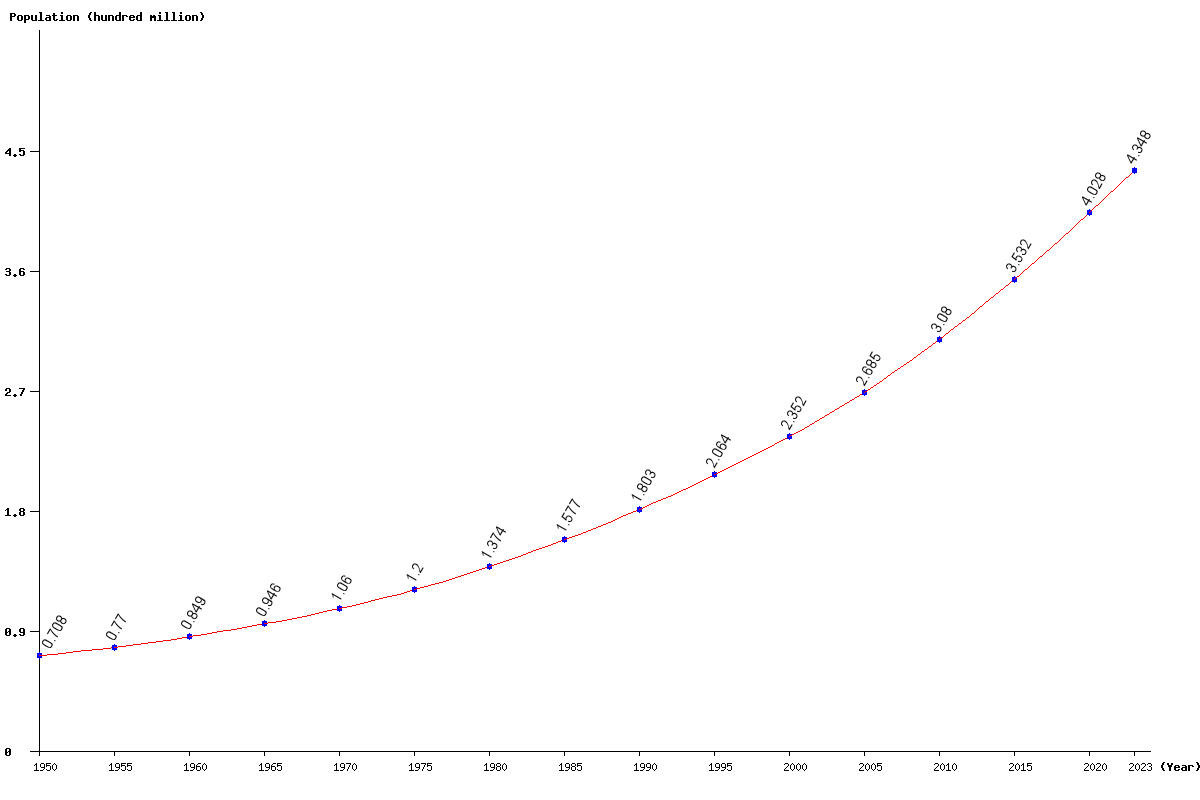
| Year | Population | Yearly % Change |
Yearly Change |
Sex ratio | Density (P/Km²) |
|---|---|---|---|---|---|
| 2025 | 457,070,899 | 2.52 | 11,238,239 | 102.40 | 75.37 |
| 2024 | 445,832,660 | 2.54 | 11,038,888 | 102.37 | 73.52 |
| 2023 | 434,793,772 | 2.56 | 10,843,398 | 102.33 | 71.70 |
| 2022 | 423,950,374 | 2.58 | 10,652,825 | 102.29 | 69.91 |
| 2021 | 413,297,549 | 2.60 | 10,466,434 | 102.25 | 68.16 |
| 2020 | 402,831,115 | 2.62 | 10,278,085 | 102.21 | 66.43 |
| 2019 | 392,553,030 | 2.64 | 10,090,214 | 102.17 | 64.73 |
| 2018 | 382,462,816 | 2.66 | 9,911,405 | 102.12 | 63.07 |
| 2017 | 372,551,411 | 2.69 | 9,744,195 | 102.07 | 61.44 |
| 2016 | 362,807,216 | 2.71 | 9,583,253 | 102.02 | 59.83 |
| 2015 | 353,223,963 | 2.74 | 9,425,182 | 101.96 | 58.25 |
| 2014 | 343,798,781 | 2.77 | 9,258,567 | 101.89 | 56.69 |
| 2013 | 334,540,214 | 2.79 | 9,072,362 | 101.82 | 55.17 |
| 2012 | 325,467,852 | 2.80 | 8,859,524 | 101.74 | 53.67 |
| 2011 | 316,608,328 | 2.80 | 8,625,915 | 101.67 | 52.21 |
| 2010 | 307,982,413 | 2.80 | 8,389,236 | 101.61 | 50.79 |
| 2005 | 268,497,834 | 14.14 | 33,262,666 | 101.46 | 44.28 |
| 2000 | 235,235,168 | 13.96 | 28,816,101 | 101.32 | 38.79 |
| 1995 | 206,419,067 | 14.47 | 26,088,509 | 101.05 | 34.04 |
| 1990 | 180,330,558 | 14.38 | 22,672,837 | 100.94 | 29.74 |
| 1985 | 157,657,721 | 14.73 | 20,243,650 | 100.87 | 26.00 |
| 1980 | 137,414,071 | 14.47 | 17,368,623 | 100.93 | 22.66 |
| 1975 | 120,045,448 | 13.23 | 14,030,252 | 100.52 | 19.80 |
| 1970 | 106,015,196 | 12.10 | 11,445,482 | 100.24 | 17.48 |
| 1965 | 94,569,714 | 11.33 | 9,624,165 | 99.93 | 15.60 |
| 1960 | 84,945,549 | 10.32 | 7,944,855 | 99.69 | 14.01 |
| 1955 | 77,000,694 | 8.81 | 6,232,030 | 99.54 | 12.70 |
| 1950 | 70,768,664 | 99.45 | 11.67 |