Switzerland population
8,345,321
Births this year: 757,950
Births today 65
Deaths this year 591,923
Deaths today 51
8,345,321
| Region Name | Percents | Number |
|---|---|---|
| Roman Catholic | 38.2% | 3,124,490 people |
| Protestant | 26.9% | 2,200,230 people |
| Muslim | 4.9% | 400,785 people |
| other Christian | 5.7% | 466,220 people |
| other | 1.6% | 130,869 people |
| none | 21.4% | 1,750,369 people |
| unspecified | 1.3% | 106,331 people |
| Ethnic groups Name | Percents | Number |
|---|---|---|
| German | 65% | 5,316,541 people |
| French | 18% | 1,472,273 people |
| Italian | 10% | 817,929 people |
| Romansch | 1% | 81,793 people |
| other | 6% | 490,758 people |
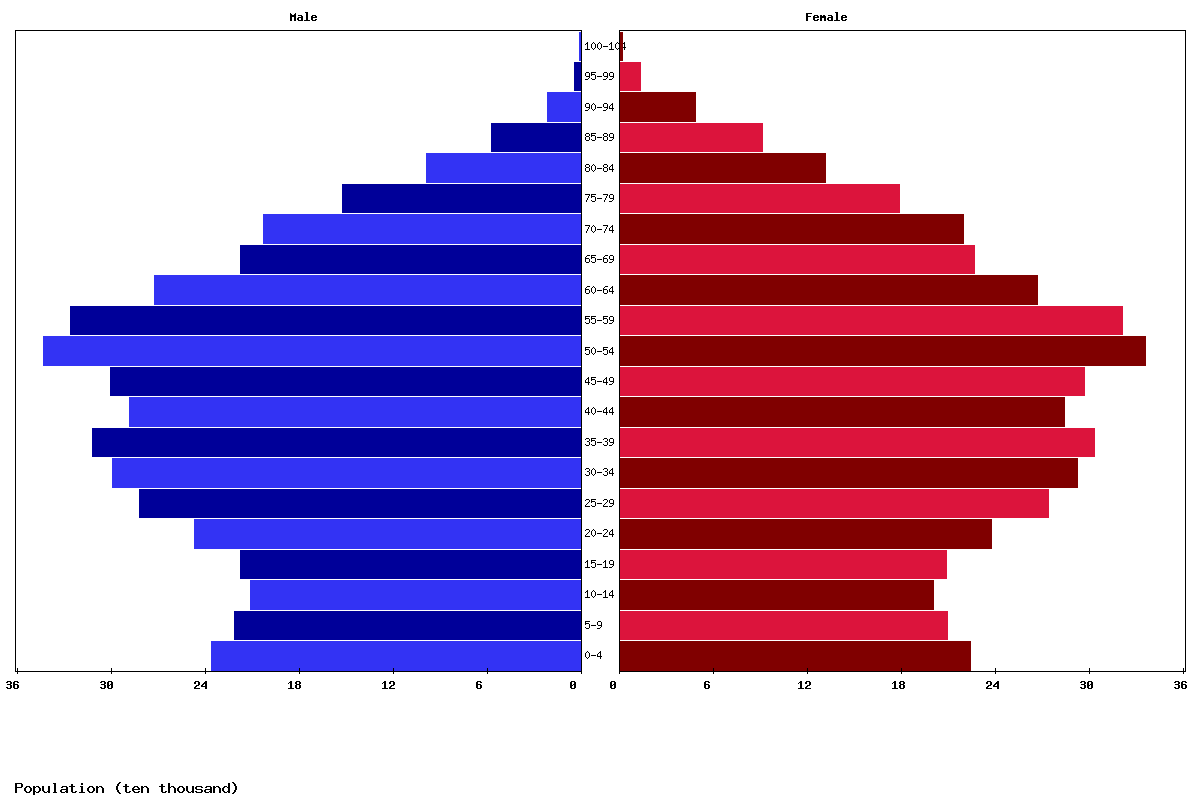
| Age | Both Sexes Population | Male Population | Female Population | Both Sexes (%) | Male (%) | Female (%) | Sex ratio (female/male) |
|---|---|---|---|---|---|---|---|
| Total | 8,951,789 | 4,449,141 | 4,502,648 | 100 | 100 | 100 | 98.8 |
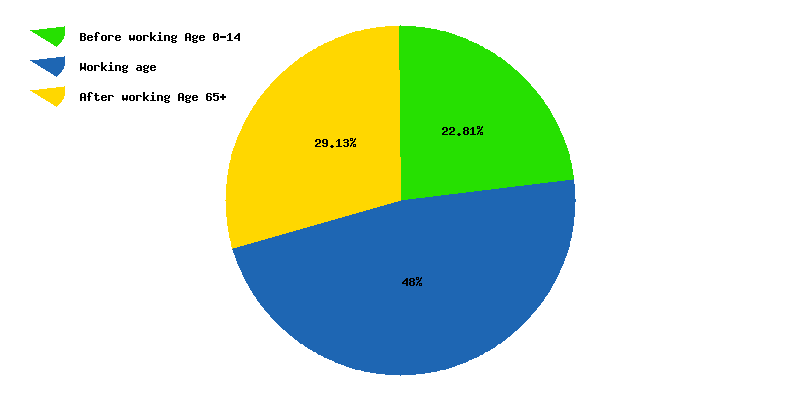
| 00-04 | 468,700 | 240,043 | 228,657 | 5.2 | 5.4 | 5.1 | 105 |
| 05-09 | 464,150 | 237,529 | 226,621 | 5.2 | 5.3 | 5 | 104.8 |
| 10-14 | 433,785 | 222,645 | 211,140 | 4.8 | 5 | 4.7 | 105.4 |
| 15-19 | 432,357 | 220,592 | 211,765 | 4.8 | 5 | 4.7 | 104.2 |
| 20-24 | 463,469 | 234,908 | 228,561 | 5.2 | 5.3 | 5.1 | 102.8 |
| 25-29 | 519,336 | 263,189 | 256,147 | 5.8 | 5.9 | 5.7 | 102.7 |
| 30-34 | 581,178 | 294,049 | 287,129 | 6.5 | 6.6 | 6.4 | 102.4 |
| 35-39 | 607,852 | 307,183 | 300,669 | 6.8 | 6.9 | 6.7 | 102.2 |
| 40-44 | 623,983 | 316,150 | 307,833 | 7 | 7.1 | 6.8 | 102.7 |
| 45-49 | 576,261 | 289,848 | 286,413 | 6.4 | 6.5 | 6.4 | 101.2 |
| 50-54 | 596,361 | 299,538 | 296,823 | 6.7 | 6.7 | 6.6 | 100.9 |
| 55-59 | 672,142 | 338,778 | 333,364 | 7.5 | 7.6 | 7.4 | 101.6 |
| 60-64 | 634,792 | 318,325 | 316,467 | 7.1 | 7.2 | 7 | 100.6 |
| 65-69 | 521,669 | 261,259 | 260,410 | 5.8 | 5.9 | 5.8 | 100.3 |
| 70-74 | 421,661 | 203,471 | 218,190 | 4.7 | 4.6 | 4.8 | 93.3 |
| 75-79 | 386,729 | 181,007 | 205,722 | 4.3 | 4.1 | 4.6 | 88 |
| 80-84 | 280,380 | 123,544 | 156,836 | 3.1 | 2.8 | 3.5 | 78.8 |
| 85-89 | 165,419 | 65,662 | 99,757 | 1.8 | 1.5 | 2.2 | 65.8 |
| 90-94 | 77,279 | 25,913 | 51,366 | 0.9 | 0.6 | 1.1 | 50.4 |
| 95-99 | 21,527 | 5,060 | 16,467 | 0.2 | 0.1 | 0.4 | 30.7 |
| 100+ | 2,759 | 448 | 2,311 | 0 | 0 | 0.1 | 19.4 |

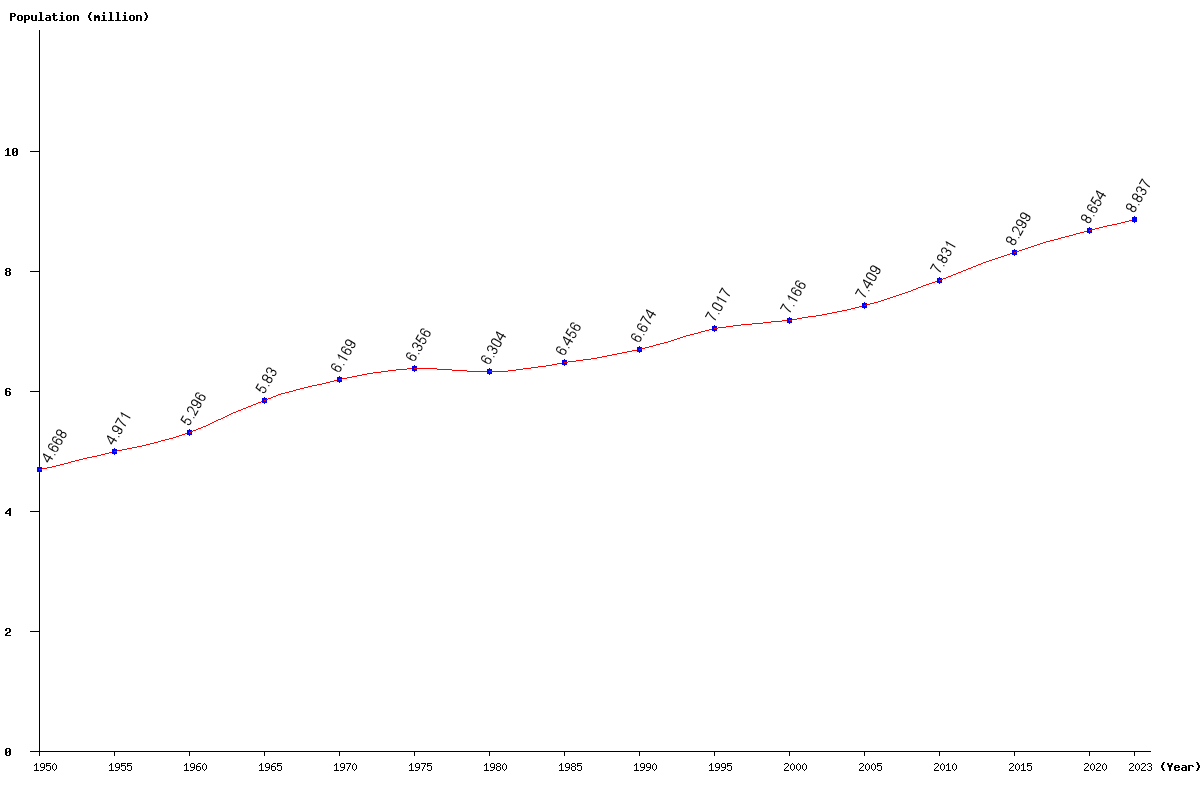
| Year | Population | Yearly % Change |
Yearly Change |
Sex ratio | Density (P/Km²) |
|---|---|---|---|---|---|
| 2024 | 8,894,852 | 0.66 | 57,909 | 98.77 | 225.09 |
| 2023 | 8,836,943 | 0.67 | 59,151 | 98.72 | 223.63 |
| 2022 | 8,777,792 | 0.70 | 60,766 | 98.66 | 222.13 |
| 2021 | 8,717,026 | 0.73 | 62,755 | 98.60 | 220.59 |
| 2020 | 8,654,271 | 0.75 | 64,423 | 98.53 | 219.01 |
| 2019 | 8,589,848 | 0.78 | 66,258 | 98.47 | 217.38 |
| 2018 | 8,523,590 | 0.82 | 69,507 | 98.40 | 215.70 |
| 2017 | 8,454,083 | 0.89 | 74,606 | 98.33 | 213.94 |
| 2016 | 8,379,477 | 0.97 | 80,814 | 98.23 | 212.05 |
| 2015 | 8,298,663 | 1.06 | 87,280 | 98.09 | 210.01 |
| 2014 | 8,211,383 | 1.14 | 92,664 | 97.92 | 207.80 |
| 2013 | 8,118,719 | 1.20 | 96,091 | 97.71 | 205.45 |
| 2012 | 8,022,628 | 1.22 | 96,815 | 97.48 | 203.02 |
| 2011 | 7,925,813 | 1.22 | 95,279 | 97.23 | 200.57 |
| 2010 | 7,830,534 | 1.20 | 93,218 | 96.98 | 198.16 |
| 2005 | 7,408,608 | 3.39 | 243,027 | 95.87 | 187.48 |
| 2000 | 7,165,581 | 2.12 | 148,539 | 95.52 | 181.33 |
| 1995 | 7,017,042 | 5.14 | 343,122 | 95.45 | 177.57 |
| 1990 | 6,673,920 | 3.38 | 218,240 | 95.36 | 168.89 |
| 1985 | 6,455,680 | 2.41 | 152,072 | 95.01 | 163.37 |
| 1980 | 6,303,608 | -0.83 | -52,570 | 94.72 | 159.52 |
| 1975 | 6,356,178 | 3.03 | 186,821 | 95.18 | 160.85 |
| 1970 | 6,169,357 | 5.82 | 339,399 | 95.53 | 156.12 |
| 1965 | 5,829,958 | 10.08 | 533,838 | 94.90 | 147.53 |
| 1960 | 5,296,120 | 6.54 | 325,310 | 93.94 | 134.02 |
| 1955 | 4,970,810 | 6.48 | 302,722 | 93.45 | 125.79 |
| 1950 | 4,668,088 | 93.02 | 118.13 |