Solomon Islands population
754,887
Births this year: 141,045
Births today 15
Deaths this year 21,185
Deaths today 2
754,887
| Region Name | Percents | Number |
|---|---|---|
| Protestant (Church of Melanesia, South Sea Evangelical, Seventh Day Adventist, United Church, Christian Fellowship Church) | 73.4% | 466,110 people |
| Roman Catholic | 19.6% | 124,465 people |
| other Christian | 2.9% | 18,416 people |
| other | 4% | 25,401 people |
| none | 0.03% | 191 people |
| unspecified | 0.1% | 635 people |
| Ethnic groups Name | Percents | Number |
|---|---|---|
| Melanesian | 95.3% | 605,181 people |
| Polynesian | 3.1% | 19,686 people |
| Micronesian | 1.2% | 7,620 people |
| other | 0.3% | 1,905 people |
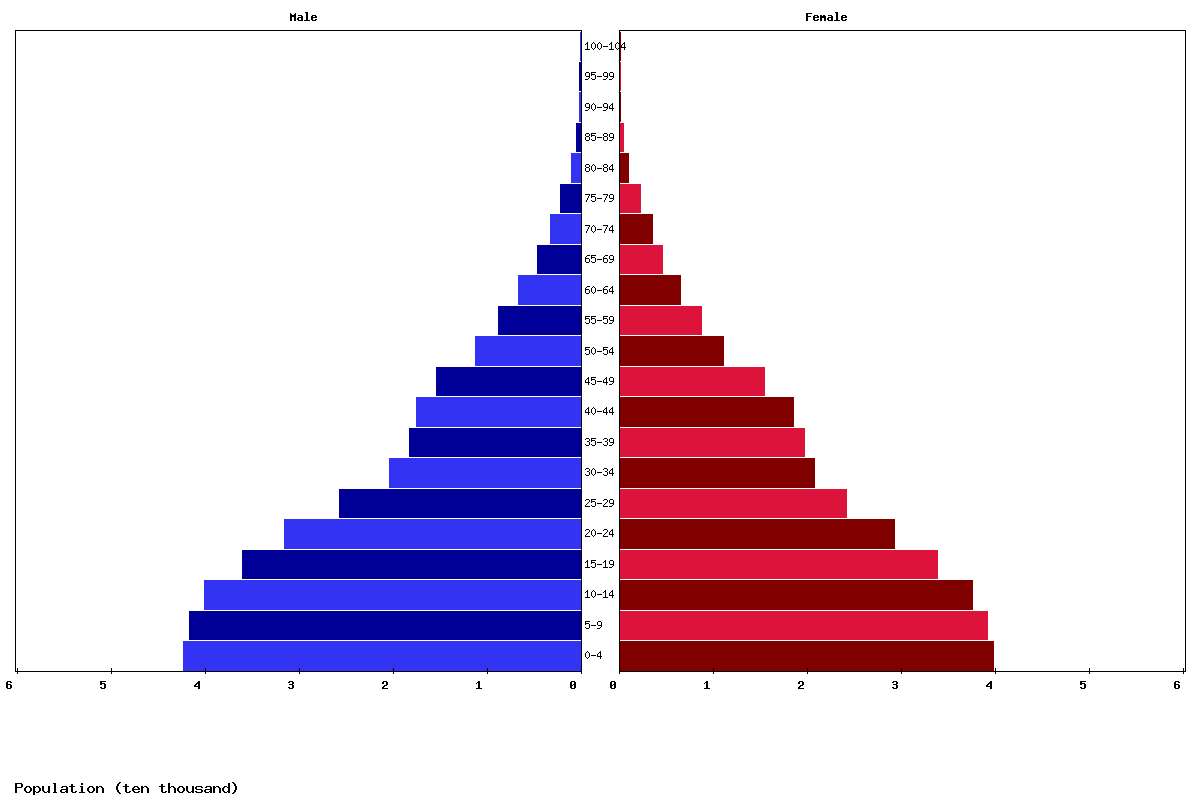
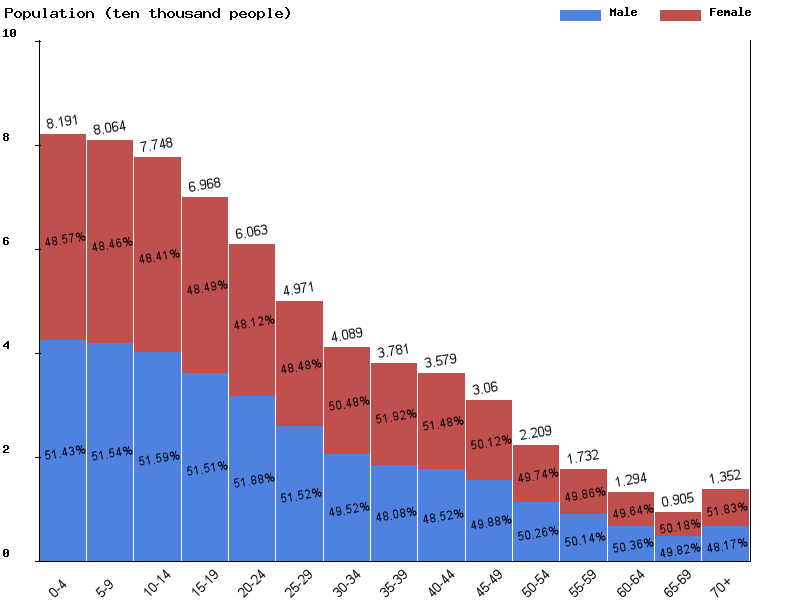
| Age | Both Sexes Population | Male Population | Female Population | Both Sexes (%) | Male (%) | Female (%) | Sex ratio (female/male) |
|---|---|---|---|---|---|---|---|
| Total | 697,512 | 354,062 | 343,450 | 100 | 100 | 100 | 103.1 |
| 00-04 | 84,178 | 43,189 | 40,989 | 12.1 | 12.2 | 11.9 | 105.4 |
| 05-09 | 80,906 | 41,597 | 39,309 | 11.6 | 11.7 | 11.4 | 105.8 |
| 10-14 | 80,130 | 41,291 | 38,839 | 11.5 | 11.7 | 11.3 | 106.3 |
| 15-19 | 76,453 | 39,430 | 37,023 | 11 | 11.1 | 10.8 | 106.5 |
| 20-24 | 67,531 | 34,775 | 32,756 | 9.7 | 9.8 | 9.5 | 106.2 |
| 25-29 | 58,010 | 30,105 | 27,905 | 8.3 | 8.5 | 8.1 | 107.9 |
| 30-34 | 47,432 | 24,449 | 22,983 | 6.8 | 6.9 | 6.7 | 106.4 |
| 35-39 | 39,117 | 19,352 | 19,765 | 5.6 | 5.5 | 5.8 | 97.9 |
| 40-44 | 36,376 | 17,454 | 18,922 | 5.2 | 4.9 | 5.5 | 92.2 |
| 45-49 | 34,477 | 16,684 | 17,793 | 4.9 | 4.7 | 5.2 | 93.8 |
| 50-54 | 29,280 | 14,541 | 14,739 | 4.2 | 4.1 | 4.3 | 98.7 |
| 55-59 | 20,799 | 10,368 | 10,431 | 3 | 2.9 | 3 | 99.4 |
| 60-64 | 15,908 | 7,864 | 8,044 | 2.3 | 2.2 | 2.3 | 97.8 |
| 65-69 | 11,372 | 5,613 | 5,759 | 1.6 | 1.6 | 1.7 | 97.5 |
| 70-74 | 7,379 | 3,578 | 3,801 | 1.1 | 1 | 1.1 | 94.1 |
| 75-79 | 4,718 | 2,177 | 2,541 | 0.7 | 0.6 | 0.7 | 85.7 |
| 80-84 | 2,453 | 1,134 | 1,319 | 0.4 | 0.3 | 0.4 | 86 |
| 85-89 | 761 | 361 | 400 | 0.1 | 0.1 | 0.1 | 90.3 |
| 90-94 | 206 | 89 | 117 | 0 | 0 | 0 | 76.1 |
| 95-99 | 24 | 10 | 14 | 0 | 0 | 0 | 71.4 |
| 100+ | 2 | 1 | 1 | 0 | 0 | 0 | 100 |


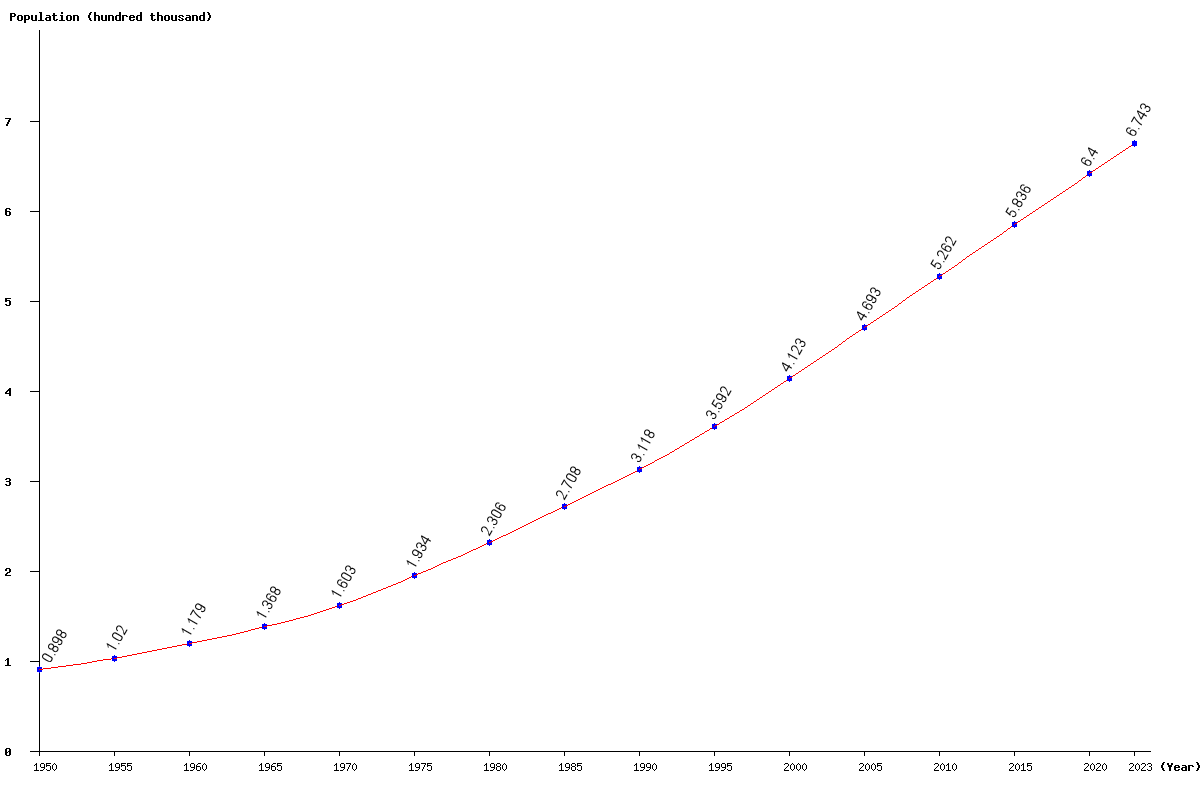
| Year | Population | Yearly % Change |
Yearly Change |
Sex ratio | Density (P/Km²) |
|---|---|---|---|---|---|
| 2024 | 685,878 | 1.71 | 11,557 | 103.11 | 24.50 |
| 2023 | 674,321 | 1.73 | 11,485 | 103.12 | 24.09 |
| 2022 | 662,836 | 1.75 | 11,422 | 103.14 | 23.68 |
| 2021 | 651,414 | 1.78 | 11,369 | 103.15 | 23.27 |
| 2020 | 640,045 | 1.80 | 11,312 | 103.16 | 22.87 |
| 2019 | 628,733 | 1.82 | 11,266 | 103.16 | 22.46 |
| 2018 | 617,467 | 1.86 | 11,252 | 103.17 | 22.06 |
| 2017 | 606,215 | 1.90 | 11,281 | 103.18 | 21.66 |
| 2016 | 594,934 | 1.94 | 11,343 | 103.17 | 21.26 |
| 2015 | 583,591 | 2.00 | 11,420 | 103.15 | 20.85 |
| 2014 | 572,171 | 2.05 | 11,486 | 103.11 | 20.44 |
| 2013 | 560,685 | 2.10 | 11,523 | 103.06 | 20.03 |
| 2012 | 549,162 | 2.14 | 11,514 | 103.02 | 19.62 |
| 2011 | 537,648 | 2.18 | 11,471 | 103.01 | 19.21 |
| 2010 | 526,177 | 2.22 | 11,410 | 103.06 | 18.80 |
| 2005 | 469,306 | 13.82 | 56,970 | 104.19 | 16.77 |
| 2000 | 412,336 | 14.78 | 53,100 | 105.62 | 14.73 |
| 1995 | 359,236 | 15.20 | 47,387 | 105.60 | 12.83 |
| 1990 | 311,849 | 15.15 | 41,040 | 105.66 | 11.14 |
| 1985 | 270,809 | 17.43 | 40,195 | 106.29 | 9.68 |
| 1980 | 230,614 | 19.21 | 37,167 | 107.02 | 8.24 |
| 1975 | 193,447 | 20.68 | 33,155 | 108.02 | 6.91 |
| 1970 | 160,292 | 17.13 | 23,445 | 110.75 | 5.73 |
| 1965 | 136,847 | 16.10 | 18,978 | 111.95 | 4.89 |
| 1960 | 117,869 | 15.53 | 15,842 | 115.75 | 4.21 |
| 1955 | 102,027 | 13.62 | 12,234 | 117.96 | 3.65 |
| 1950 | 89,793 | 122.82 | 3.21 |
