Slovenia population
1,922,308
Births this year: 144,527
Births today 7
Deaths this year 200,248
Deaths today 9
1,922,308
| Region Name | Percents | Number |
|---|---|---|
| Catholic | 57.8% | 1,143,301 people |
| Muslim | 2.4% | 47,473 people |
| Orthodox | 2.3% | 45,495 people |
| other Christian | 0.9% | 17,802 people |
| unaffiliated | 3.5% | 69,231 people |
| other or unspecified | 23% | 454,947 people |
| none | 10.1% | 199,781 people |
| Ethnic groups Name | Percents | Number |
|---|---|---|
| Slovene | 83.1% | 1,643,742 people |
| Serb 2, Croat 1.8 | 21.8% | 431,210 people |
| Bosniak | 1.1% | 21,758 people |
| other or unspecified | 12% | 237,363 people |
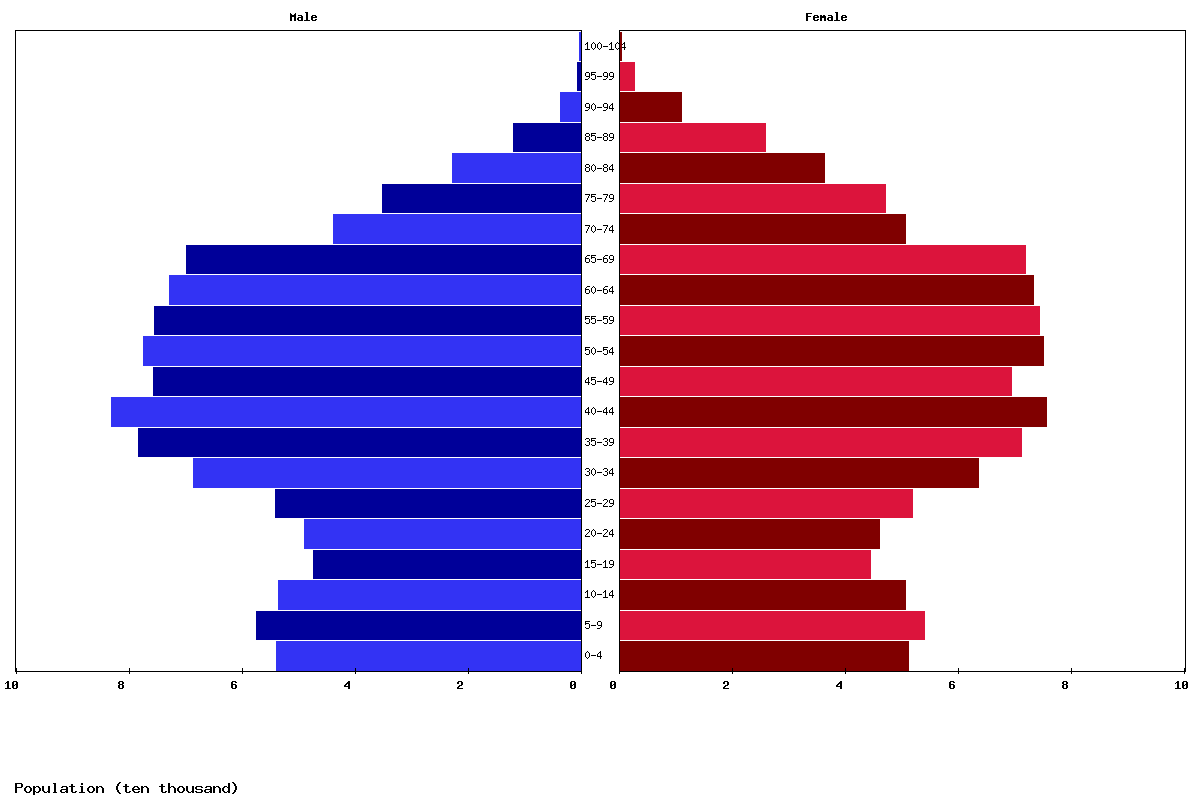
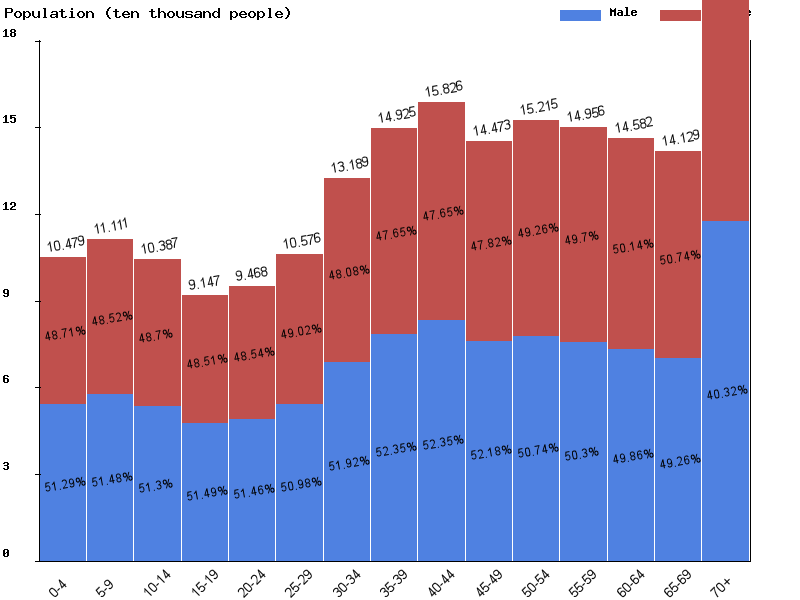
| Age | Both Sexes Population | Male Population | Female Population | Both Sexes (%) | Male (%) | Female (%) | Sex ratio (female/male) |
|---|---|---|---|---|---|---|---|
| Total | 2,069,744 | 1,029,901 | 1,039,843 | 100 | 100 | 100 | 99 |
| 00-04 | 96,591 | 49,546 | 47,045 | 4.7 | 4.8 | 4.5 | 105.3 |
| 05-09 | 104,911 | 53,804 | 51,107 | 5.1 | 5.2 | 4.9 | 105.3 |
| 10-14 | 111,188 | 57,228 | 53,960 | 5.4 | 5.6 | 5.2 | 106.1 |
| 15-19 | 104,452 | 53,548 | 50,904 | 5 | 5.2 | 4.9 | 105.2 |
| 20-24 | 92,514 | 47,569 | 44,945 | 4.5 | 4.6 | 4.3 | 105.8 |
| 25-29 | 95,606 | 49,128 | 46,478 | 4.6 | 4.8 | 4.5 | 105.7 |
| 30-34 | 106,372 | 54,173 | 52,199 | 5.1 | 5.3 | 5 | 103.8 |
| 35-39 | 132,079 | 68,513 | 63,566 | 6.4 | 6.7 | 6.1 | 107.8 |
| 40-44 | 148,975 | 77,890 | 71,085 | 7.2 | 7.6 | 6.8 | 109.6 |
| 45-49 | 157,460 | 82,296 | 75,164 | 7.6 | 8 | 7.2 | 109.5 |
| 50-54 | 143,282 | 74,516 | 68,766 | 6.9 | 7.2 | 6.6 | 108.4 |
| 55-59 | 149,249 | 75,231 | 74,018 | 7.2 | 7.3 | 7.1 | 101.6 |
| 60-64 | 144,808 | 72,053 | 72,755 | 7 | 7 | 7 | 99 |
| 65-69 | 138,987 | 68,014 | 70,973 | 6.7 | 6.6 | 6.8 | 95.8 |
| 70-74 | 131,569 | 63,086 | 68,483 | 6.4 | 6.1 | 6.6 | 92.1 |
| 75-79 | 83,865 | 37,341 | 46,524 | 4.1 | 3.6 | 4.5 | 80.3 |
| 80-84 | 65,884 | 26,353 | 39,531 | 3.2 | 2.6 | 3.8 | 66.7 |
| 85-89 | 39,177 | 13,696 | 25,481 | 1.9 | 1.3 | 2.5 | 53.7 |
| 90-94 | 17,941 | 5,000 | 12,941 | 0.9 | 0.5 | 1.2 | 38.6 |
| 95-99 | 4,279 | 846 | 3,433 | 0.2 | 0.1 | 0.3 | 24.6 |
| 100+ | 555 | 70 | 485 | 0 | 0 | 0 | 14.4 |
| Year | Population | Yearly % Change |
Yearly Change |
Sex ratio | Density (P/Km²) |
|---|---|---|---|---|---|
| 2024 | 2,071,766 | -0.08 | -1,580 | 98.99 | 102.87 |
| 2023 | 2,073,346 | -0.05 | -1,095 | 98.93 | 102.95 |
| 2022 | 2,074,441 | -0.03 | -564 | 98.86 | 103.00 |
| 2021 | 2,075,005 | -0.00 | -6 | 98.79 | 103.03 |
| 2020 | 2,075,011 | 0.03 | 664 | 98.71 | 103.03 |
| 2019 | 2,074,347 | 0.06 | 1,329 | 98.62 | 103.00 |
| 2018 | 2,073,018 | 0.09 | 1,766 | 98.50 | 102.93 |
| 2017 | 2,071,252 | 0.09 | 1,890 | 98.40 | 102.84 |
| 2016 | 2,069,362 | 0.09 | 1,836 | 98.32 | 102.75 |
| 2015 | 2,067,526 | 0.07 | 1,458 | 98.29 | 102.66 |
| 2014 | 2,066,068 | 0.06 | 1,249 | 98.32 | 102.59 |
| 2013 | 2,064,819 | 0.09 | 1,938 | 98.41 | 102.52 |
| 2012 | 2,062,881 | 0.19 | 3,858 | 98.47 | 102.43 |
| 2011 | 2,059,023 | 0.32 | 6,543 | 98.42 | 102.24 |
| 2010 | 2,052,480 | 0.47 | 9,676 | 98.19 | 101.91 |
| 2005 | 1,996,522 | 0.40 | 7,870 | 95.36 | 99.13 |
| 2000 | 1,988,652 | -0.14 | -2,835 | 95.38 | 98.74 |
| 1995 | 1,991,487 | -0.75 | -15,033 | 94.04 | 98.88 |
| 1990 | 2,006,520 | 3.16 | 61,384 | 94.31 | 99.63 |
| 1985 | 1,945,136 | 5.95 | 109,297 | 94.53 | 96.58 |
| 1980 | 1,835,839 | 5.35 | 93,213 | 93.12 | 91.15 |
| 1975 | 1,742,626 | 4.37 | 73,043 | 93.85 | 86.53 |
| 1970 | 1,669,583 | 2.46 | 40,149 | 93.81 | 82.90 |
| 1965 | 1,629,434 | 2.70 | 42,802 | 91.88 | 80.91 |
| 1960 | 1,586,632 | 3.89 | 59,427 | 91.96 | 78.78 |
| 1955 | 1,527,205 | 3.67 | 54,111 | 91.69 | 75.83 |
| 1950 | 1,473,094 | 91.59 | 73.14 |
