Serbia population
685,409
Births this year: 56,706
Births today 3
Deaths this year 85,689
Deaths today 4
685,409
| Region Name | Percents | Number |
|---|---|---|
| Serbian Orthodox | 84.6% | 604,376 people |
| Catholic | 5% | 35,720 people |
| Muslim | 3.1% | 22,146 people |
| Protestant | 1% | 7,144 people |
| atheist | 1.1% | 7,858 people |
| other | 0.8% | 5,715 people |
| undeclared or unknown | 4.5% | 32,148 people |
| Ethnic groups Name | Percents | Number |
|---|---|---|
| Serb | 83.3% | 595,089 people |
| Hungarian | 3.5% | 25,004 people |
| Romany | 2.1% | 15,002 people |
| Bosniak | 2% | 14,288 people |
| other | 5.7% | 40,720 people |
| undeclared or unknown | 3.4% | 24,289 people |
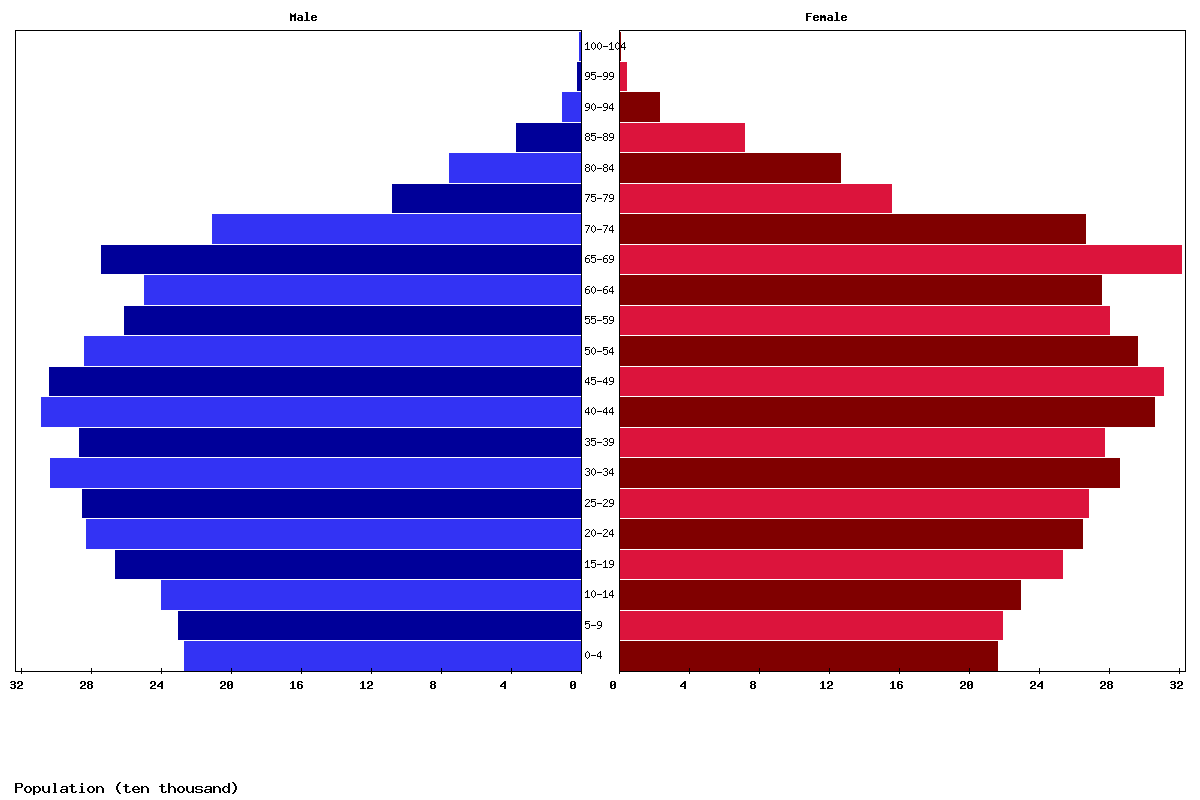
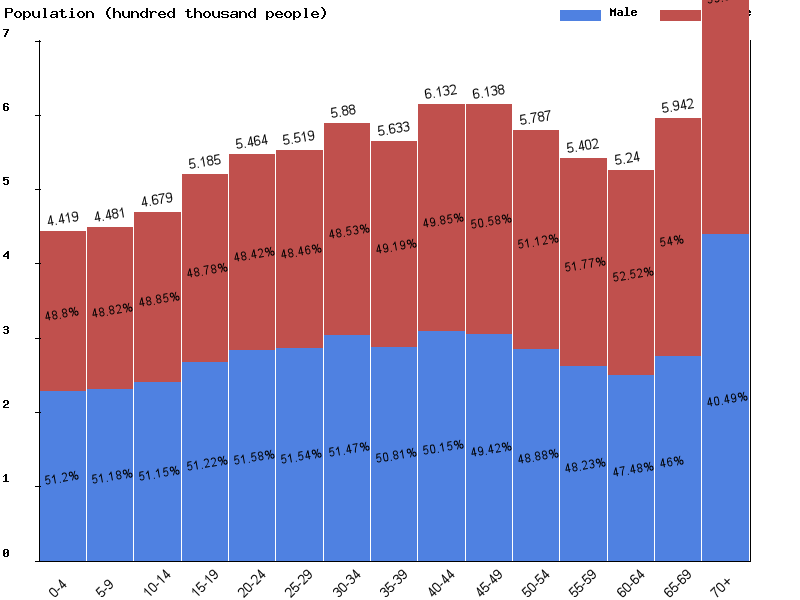
| Age | Both Sexes Population | Male Population | Female Population | Both Sexes (%) | Male (%) | Female (%) | Sex ratio (female/male) |
|---|---|---|---|---|---|---|---|
| Total | 8,484,772 | 4,137,546 | 4,347,226 | 100 | 100 | 100 | 95.2 |
| 00-04 | 430,896 | 220,641 | 210,255 | 5.1 | 5.3 | 4.8 | 104.9 |
| 05-09 | 439,197 | 224,837 | 214,360 | 5.2 | 5.4 | 4.9 | 104.9 |
| 10-14 | 446,571 | 228,549 | 218,022 | 5.3 | 5.5 | 5 | 104.8 |
| 15-19 | 464,140 | 237,437 | 226,703 | 5.5 | 5.7 | 5.2 | 104.7 |
| 20-24 | 509,865 | 261,148 | 248,717 | 6 | 6.3 | 5.7 | 105 |
| 25-29 | 535,446 | 276,108 | 259,338 | 6.3 | 6.7 | 6 | 106.5 |
| 30-34 | 542,061 | 279,167 | 262,894 | 6.4 | 6.7 | 6 | 106.2 |
| 35-39 | 579,592 | 297,887 | 281,705 | 6.8 | 7.2 | 6.5 | 105.7 |
| 40-44 | 555,236 | 281,363 | 273,873 | 6.5 | 6.8 | 6.3 | 102.7 |
| 45-49 | 602,892 | 301,041 | 301,851 | 7.1 | 7.3 | 6.9 | 99.7 |
| 50-54 | 599,440 | 294,160 | 305,280 | 7.1 | 7.1 | 7 | 96.4 |
| 55-59 | 558,575 | 269,863 | 288,712 | 6.6 | 6.5 | 6.6 | 93.5 |
| 60-64 | 511,366 | 241,753 | 269,613 | 6 | 5.8 | 6.2 | 89.7 |
| 65-69 | 480,883 | 221,415 | 259,468 | 5.7 | 5.4 | 6 | 85.3 |
| 70-74 | 518,479 | 229,209 | 289,270 | 6.1 | 5.5 | 6.7 | 79.2 |
| 75-79 | 378,751 | 157,468 | 221,283 | 4.5 | 3.8 | 5.1 | 71.2 |
| 80-84 | 178,398 | 66,588 | 111,810 | 2.1 | 1.6 | 2.6 | 59.6 |
| 85-89 | 106,319 | 35,321 | 70,998 | 1.3 | 0.9 | 1.6 | 49.7 |
| 90-94 | 39,201 | 11,638 | 27,563 | 0.5 | 0.3 | 0.6 | 42.2 |
| 95-99 | 6,904 | 1,821 | 5,083 | 0.1 | 0 | 0.1 | 35.8 |
| 100+ | 560 | 132 | 428 | 0 | 0 | 0 | 30.8 |
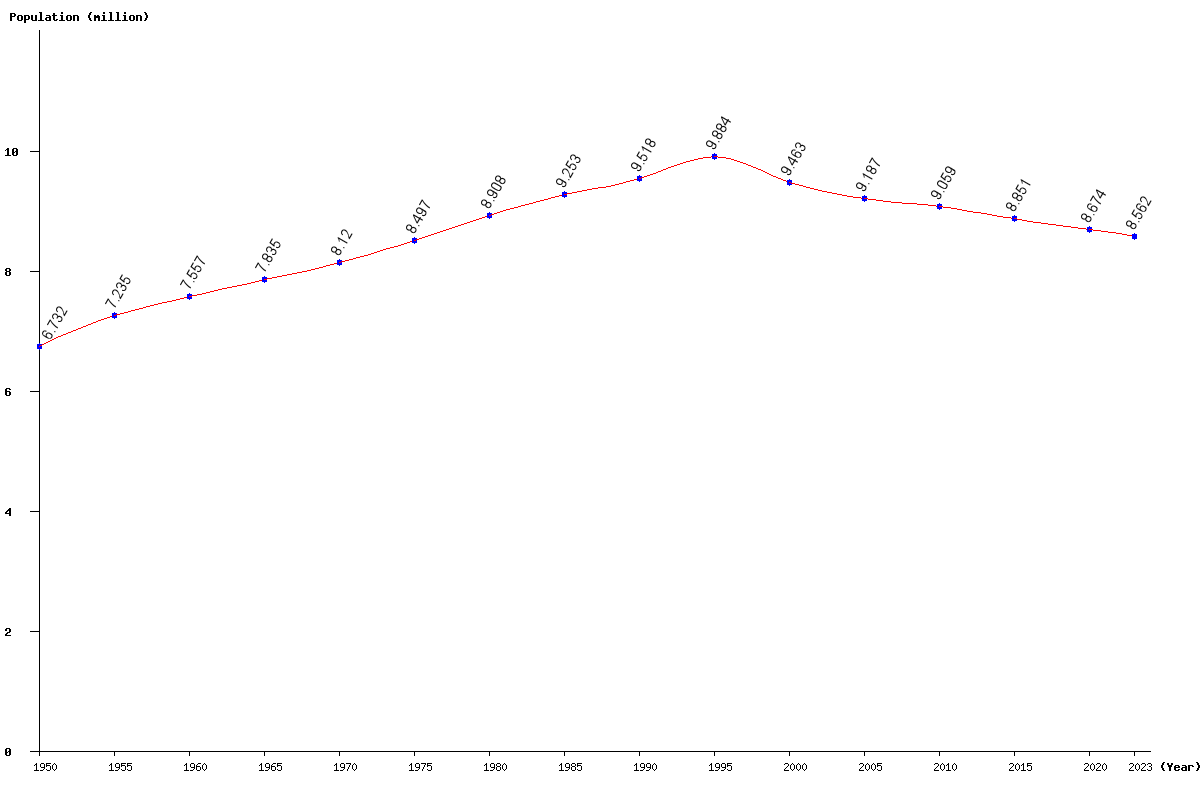
| Year | Population | Yearly % Change |
Yearly Change |
Sex ratio | Density (P/Km²) |
|---|---|---|---|---|---|
| 2024 | 8,523,710 | -0.45 | -38,509 | 95.18 | 97.46 |
| 2023 | 8,562,219 | -0.44 | -37,939 | 95.19 | 97.90 |
| 2022 | 8,600,158 | -0.43 | -37,156 | 95.20 | 98.33 |
| 2021 | 8,637,314 | -0.42 | -36,290 | 95.21 | 98.76 |
| 2020 | 8,673,604 | -0.40 | -35,081 | 95.22 | 99.17 |
| 2019 | 8,708,685 | -0.39 | -34,079 | 95.23 | 99.57 |
| 2018 | 8,742,764 | -0.39 | -34,176 | 95.25 | 99.96 |
| 2017 | 8,776,940 | -0.41 | -35,765 | 95.26 | 100.35 |
| 2016 | 8,812,705 | -0.43 | -38,270 | 95.29 | 100.76 |
| 2015 | 8,850,975 | -0.47 | -41,840 | 95.33 | 101.20 |
| 2014 | 8,892,815 | -0.50 | -44,790 | 95.38 | 101.68 |
| 2013 | 8,937,605 | -0.50 | -44,973 | 95.45 | 102.19 |
| 2012 | 8,982,578 | -0.46 | -41,303 | 95.51 | 102.70 |
| 2011 | 9,023,881 | -0.39 | -35,165 | 95.57 | 103.18 |
| 2010 | 9,059,046 | -0.31 | -27,973 | 95.60 | 103.58 |
| 2005 | 9,186,685 | -2.92 | -276,621 | 95.64 | 105.04 |
| 2000 | 9,463,306 | -4.26 | -420,840 | 96.38 | 108.20 |
| 1995 | 9,884,146 | 3.85 | 366,476 | 97.15 | 113.01 |
| 1990 | 9,517,670 | 2.86 | 264,269 | 97.48 | 108.82 |
| 1985 | 9,253,401 | 3.87 | 345,108 | 97.74 | 105.80 |
| 1980 | 8,908,293 | 4.84 | 411,125 | 97.78 | 101.86 |
| 1975 | 8,497,168 | 4.65 | 377,307 | 97.87 | 97.15 |
| 1970 | 8,119,861 | 3.63 | 284,777 | 97.76 | 92.84 |
| 1965 | 7,835,084 | 3.68 | 278,354 | 97.51 | 89.58 |
| 1960 | 7,556,730 | 4.45 | 321,814 | 96.83 | 86.40 |
| 1955 | 7,234,916 | 7.47 | 502,660 | 95.90 | 82.72 |
| 1950 | 6,732,256 | 94.44 | 76.98 |