Saint Kitts and Nevis population
55,191
Births this year: 6,140
Births today 0
Deaths this year 3,278
Deaths today 0
55,191
| Region Name | Percents | Number |
|---|---|---|
| Anglican, other Protestant, Roman Catholic | 0 people |
| Ethnic groups Name | Percents | Number |
|---|---|---|
| predominantly black | 0 people | |
| some British, Portuguese, and Lebanese | 100% | 52,329 people |
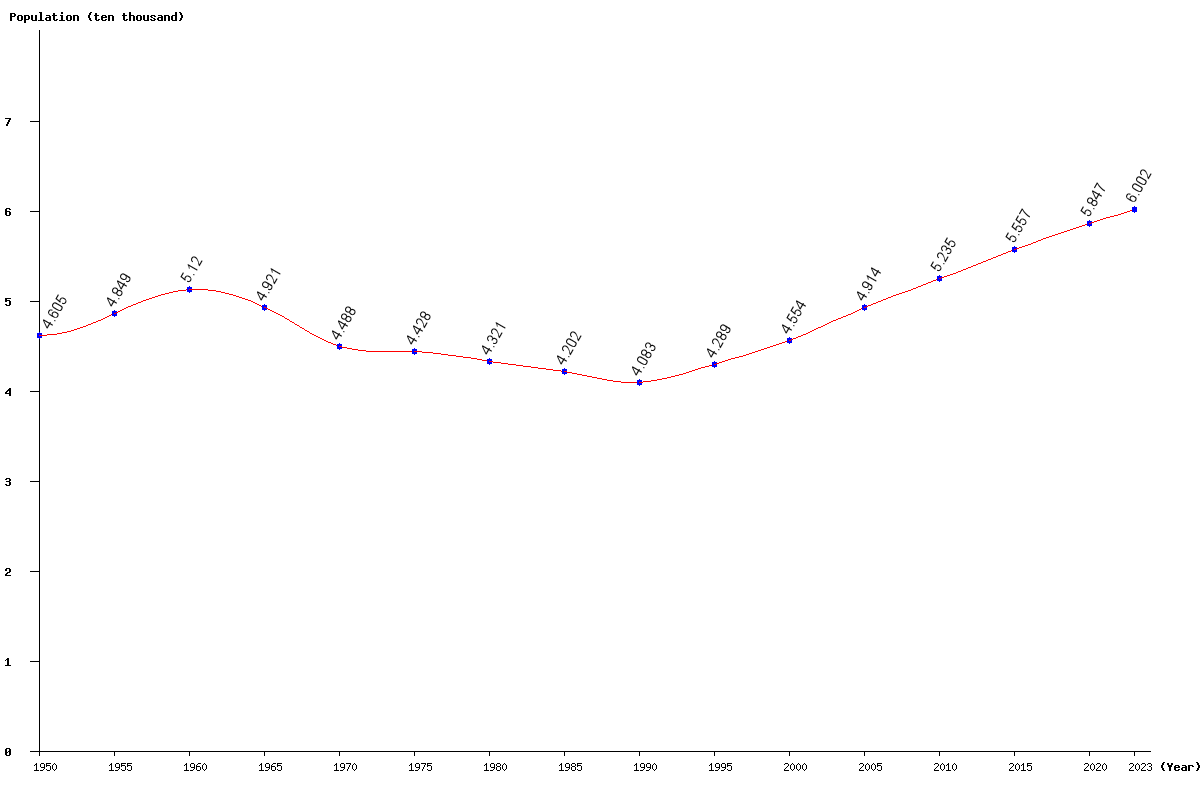
| Year | Population | Yearly % Change |
Yearly Change |
Sex ratio | Density (P/Km²) |
|---|---|---|---|---|---|
| 2024 | 60,501 | 0.80 | 483 | 98.21 | 232.70 |
| 2023 | 60,018 | 0.84 | 498 | 98.25 | 230.84 |
| 2022 | 59,520 | 0.87 | 515 | 98.28 | 228.92 |
| 2021 | 59,005 | 0.91 | 532 | 98.29 | 226.94 |
| 2020 | 58,473 | 0.95 | 548 | 98.27 | 224.90 |
| 2019 | 57,925 | 0.99 | 565 | 98.21 | 222.79 |
| 2018 | 57,360 | 1.02 | 580 | 98.12 | 220.62 |
| 2017 | 56,780 | 1.06 | 597 | 98.00 | 218.38 |
| 2016 | 56,183 | 1.10 | 611 | 97.86 | 216.09 |
| 2015 | 55,572 | 1.14 | 628 | 97.71 | 213.74 |
| 2014 | 54,944 | 1.18 | 643 | 97.53 | 211.32 |
| 2013 | 54,301 | 1.21 | 651 | 97.34 | 208.85 |
| 2012 | 53,650 | 1.23 | 652 | 97.16 | 206.35 |
| 2011 | 52,998 | 1.23 | 646 | 97.01 | 203.84 |
| 2010 | 52,352 | 1.23 | 635 | 96.92 | 201.35 |
| 2005 | 49,139 | 7.89 | 3,595 | 97.31 | 189.00 |
| 2000 | 45,544 | 6.19 | 2,656 | 98.22 | 175.17 |
| 1995 | 42,888 | 5.03 | 2,055 | 99.01 | 164.95 |
| 1990 | 40,833 | -2.82 | -1,184 | 99.59 | 157.05 |
| 1985 | 42,017 | -2.75 | -1,188 | 99.33 | 161.60 |
| 1980 | 43,205 | -2.42 | -1,073 | 98.98 | 166.17 |
| 1975 | 44,278 | -1.35 | -604 | 98.40 | 170.30 |
| 1970 | 44,882 | -8.80 | -4,329 | 97.83 | 172.62 |
| 1965 | 49,211 | -3.88 | -1,986 | 97.49 | 189.27 |
| 1960 | 51,197 | 5.57 | 2,703 | 99.31 | 196.91 |
| 1955 | 48,494 | 5.30 | 2,440 | 99.10 | 186.52 |
| 1950 | 46,054 | 98.96 | 177.13 |