Oceania population
0
Births this year: 0
Births today 0
Deaths this year 0
Deaths today 0
0
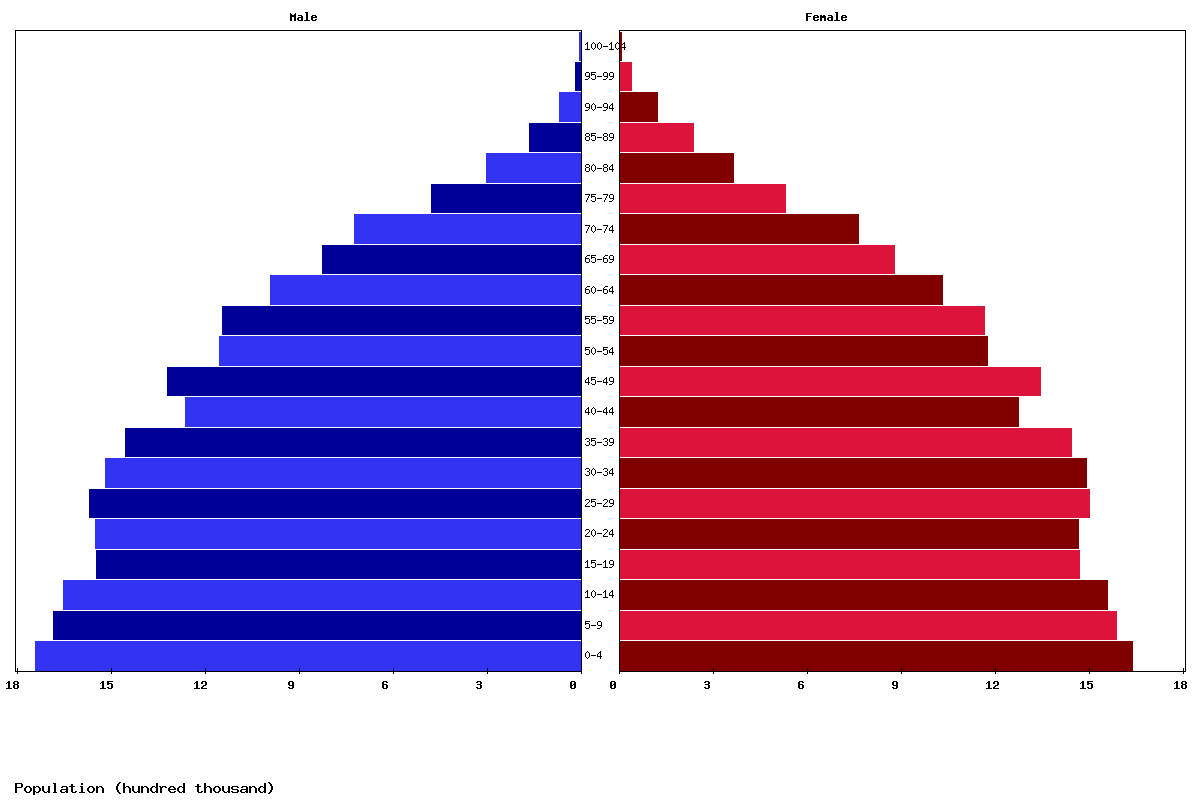
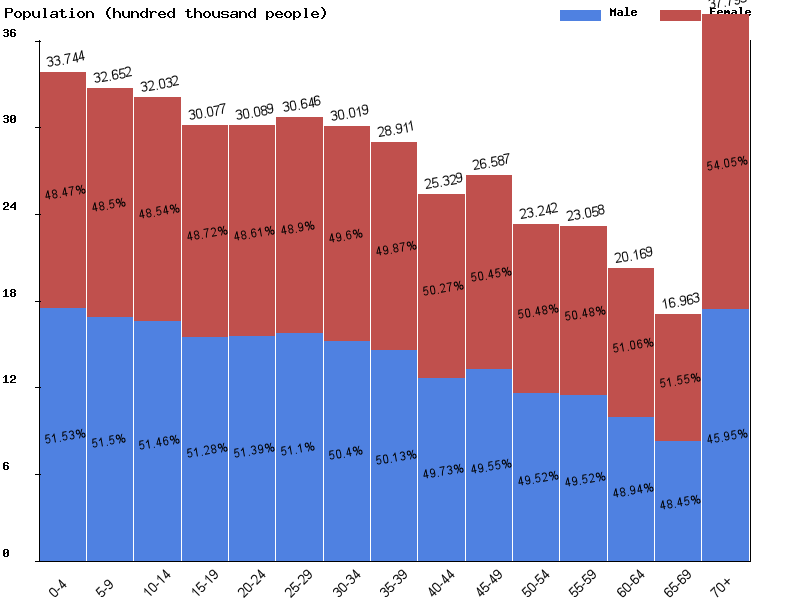
| Age | Both Sexes Population | Male Population | Female Population | Both Sexes (%) | Male (%) | Female (%) | Sex ratio (female/male) |
|---|---|---|---|---|---|---|---|
| Total | 44,791,401 | 22,423,138 | 22,368,263 | 100 | 100 | 100 | 100.2 |
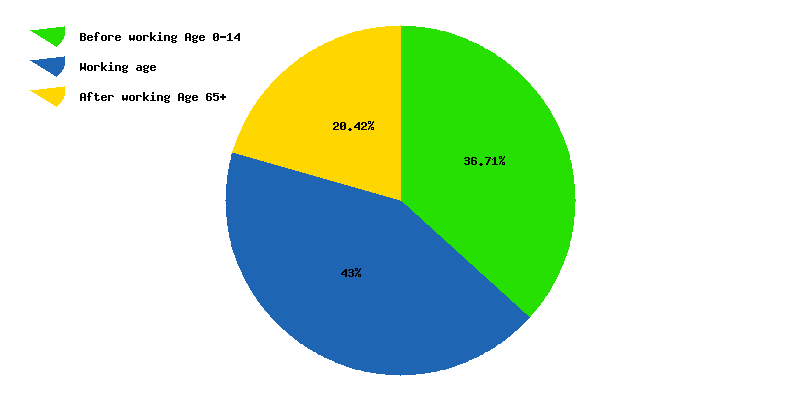
| 00-04 | 3,434,442 | 1,769,919 | 1,664,523 | 7.7 | 7.9 | 7.4 | 106.3 |
| 05-09 | 3,434,545 | 1,768,914 | 1,665,631 | 7.7 | 7.9 | 7.4 | 106.2 |
| 10-14 | 3,339,828 | 1,717,726 | 1,622,102 | 7.5 | 7.7 | 7.3 | 105.9 |
| 15-19 | 3,285,376 | 1,685,652 | 1,599,724 | 7.3 | 7.5 | 7.2 | 105.4 |
| 20-24 | 3,092,269 | 1,577,947 | 1,514,322 | 6.9 | 7 | 6.8 | 104.2 |
| 25-29 | 3,086,471 | 1,577,808 | 1,508,663 | 6.9 | 7 | 6.7 | 104.6 |
| 30-34 | 3,132,000 | 1,594,304 | 1,537,696 | 7 | 7.1 | 6.9 | 103.7 |
| 35-39 | 3,050,385 | 1,533,713 | 1,516,672 | 6.8 | 6.8 | 6.8 | 101.1 |
| 40-44 | 2,910,419 | 1,456,441 | 1,453,978 | 6.5 | 6.5 | 6.5 | 100.2 |
| 45-49 | 2,524,808 | 1,252,649 | 1,272,159 | 5.6 | 5.6 | 5.7 | 98.5 |
| 50-54 | 2,619,271 | 1,293,340 | 1,325,931 | 5.8 | 5.8 | 5.9 | 97.5 |
| 55-59 | 2,271,648 | 1,119,211 | 1,152,437 | 5.1 | 5 | 5.2 | 97.1 |
| 60-64 | 2,230,689 | 1,096,520 | 1,134,169 | 5 | 4.9 | 5.1 | 96.7 |
| 65-69 | 1,921,093 | 930,021 | 991,072 | 4.3 | 4.1 | 4.4 | 93.8 |
| 70-74 | 1,574,739 | 751,228 | 823,511 | 3.5 | 3.4 | 3.7 | 91.2 |
| 75-79 | 1,318,466 | 626,487 | 691,979 | 2.9 | 2.8 | 3.1 | 90.5 |
| 80-84 | 822,277 | 374,674 | 447,603 | 1.8 | 1.7 | 2 | 83.7 |
| 85-89 | 463,852 | 197,475 | 266,377 | 1 | 0.9 | 1.2 | 74.1 |
| 90-94 | 208,327 | 77,812 | 130,515 | 0.5 | 0.3 | 0.6 | 59.6 |
| 95-99 | 62,002 | 19,232 | 42,770 | 0.1 | 0.1 | 0.2 | 45 |
| 100+ | 8,494 | 2,065 | 6,429 | 0 | 0 | 0 | 32.1 |
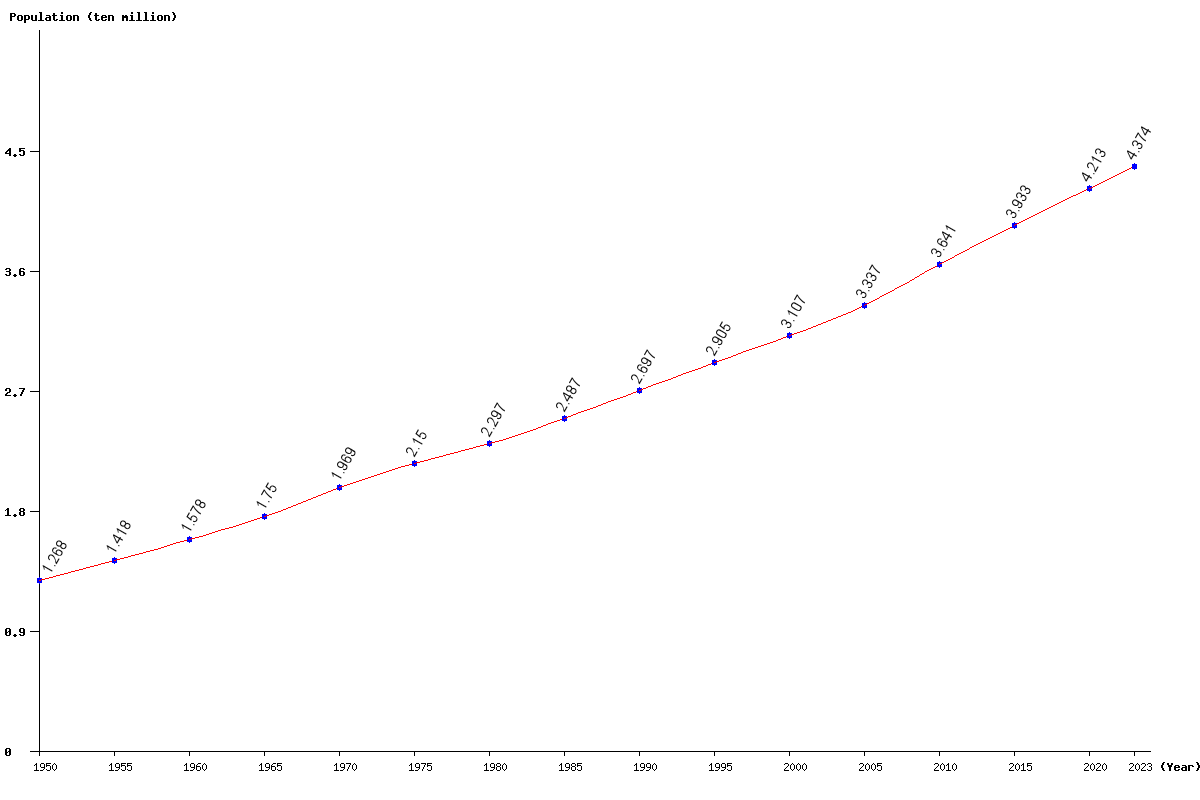
| Year | Population | Yearly % Change |
Yearly Change |
Sex ratio | Density (P/Km²) |
|---|---|---|---|---|---|
| 2024 | 44,267,425 | 1.20 | 526,973 | 100.27 | 5.22 |
| 2023 | 43,740,452 | 1.23 | 530,871 | 100.29 | 5.15 |
| 2022 | 43,209,581 | 1.26 | 536,083 | 100.30 | 5.09 |
| 2021 | 42,673,498 | 1.29 | 542,232 | 100.32 | 5.03 |
| 2020 | 42,131,266 | 1.32 | 548,702 | 100.33 | 4.96 |
| 2019 | 41,582,564 | 1.35 | 554,886 | 100.35 | 4.90 |
| 2018 | 41,027,678 | 1.39 | 560,638 | 100.36 | 4.83 |
| 2017 | 40,467,040 | 1.42 | 565,685 | 100.37 | 4.77 |
| 2016 | 39,901,355 | 1.45 | 570,225 | 100.39 | 4.70 |
| 2015 | 39,331,130 | 1.48 | 572,344 | 100.42 | 4.63 |
| 2014 | 38,758,786 | 1.50 | 574,120 | 100.47 | 4.57 |
| 2013 | 38,184,666 | 1.54 | 579,652 | 100.54 | 4.50 |
| 2012 | 37,605,014 | 1.60 | 590,493 | 100.60 | 4.43 |
| 2011 | 37,014,521 | 1.66 | 603,742 | 100.65 | 4.36 |
| 2010 | 36,410,779 | 1.73 | 619,586 | 100.66 | 4.29 |
| 2005 | 33,369,472 | 7.41 | 2,301,852 | 100.26 | 3.93 |
| 2000 | 31,067,620 | 6.93 | 2,013,776 | 100.25 | 3.66 |
| 1995 | 29,053,844 | 7.72 | 2,083,282 | 100.09 | 3.42 |
| 1990 | 26,970,562 | 8.43 | 2,097,456 | 100.42 | 3.18 |
| 1985 | 24,873,106 | 8.27 | 1,900,827 | 100.78 | 2.93 |
| 1980 | 22,972,279 | 6.86 | 1,474,080 | 100.91 | 2.71 |
| 1975 | 21,498,199 | 9.19 | 1,810,211 | 101.57 | 2.53 |
| 1970 | 19,687,988 | 12.49 | 2,185,757 | 102.04 | 2.32 |
| 1965 | 17,502,231 | 10.89 | 1,718,649 | 102.43 | 2.06 |
| 1960 | 15,783,582 | 11.35 | 1,608,523 | 103.10 | 1.86 |
| 1955 | 14,175,059 | 11.77 | 1,493,113 | 103.63 | 1.67 |
| 1950 | 12,681,946 | 103.58 | 1.49 |