North america population
0
Births this year: 0
Births today 0
Deaths this year 0
Deaths today 0
0
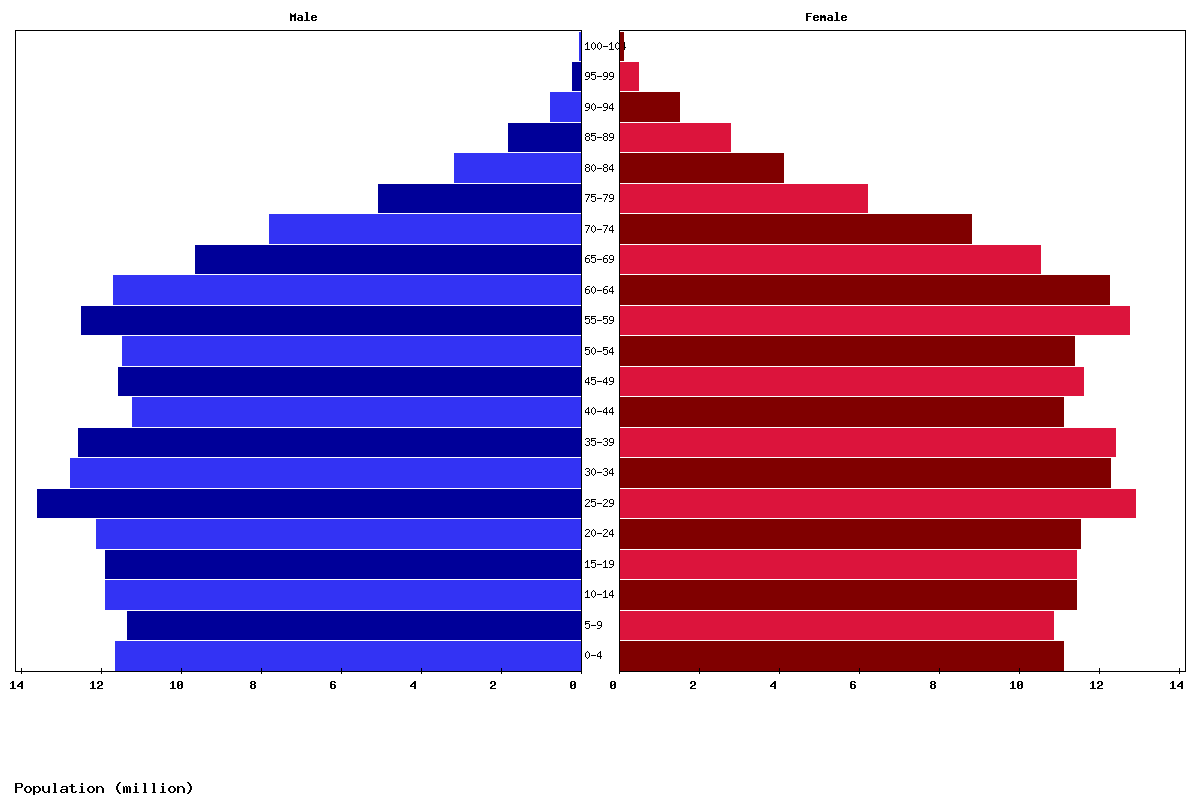
| Age | Both Sexes Population | Male Population | Female Population | Both Sexes (%) | Male (%) | Female (%) | Sex ratio (female/male) |
|---|---|---|---|---|---|---|---|
| Total | 384,273,719 | 190,558,636 | 193,715,083 | 100 | 100 | 100 | 98.4 |
| 00-04 | 23,306,157 | 11,920,608 | 11,385,549 | 6.1 | 6.3 | 5.9 | 104.7 |
| 05-09 | 23,169,294 | 11,840,030 | 11,329,264 | 6 | 6.2 | 5.8 | 104.5 |
| 10-14 | 22,804,477 | 11,638,214 | 11,166,263 | 5.9 | 6.1 | 5.8 | 104.2 |
| 15-19 | 24,029,565 | 12,231,594 | 11,797,971 | 6.3 | 6.4 | 6.1 | 103.7 |
| 20-24 | 24,021,464 | 12,205,829 | 11,815,635 | 6.3 | 6.4 | 6.1 | 103.3 |
| 25-29 | 24,273,429 | 12,370,383 | 11,903,046 | 6.3 | 6.5 | 6.1 | 103.9 |
| 30-34 | 26,986,765 | 13,793,866 | 13,192,899 | 7 | 7.2 | 6.8 | 104.6 |
| 35-39 | 25,332,245 | 12,872,595 | 12,459,650 | 6.6 | 6.8 | 6.4 | 103.3 |
| 40-44 | 25,063,083 | 12,587,668 | 12,475,415 | 6.5 | 6.6 | 6.4 | 100.9 |
| 45-49 | 22,273,548 | 11,166,176 | 11,107,372 | 5.8 | 5.9 | 5.7 | 100.5 |
| 50-54 | 22,898,664 | 11,385,207 | 11,513,457 | 6 | 6 | 5.9 | 98.9 |
| 55-59 | 22,372,314 | 11,154,794 | 11,217,520 | 5.8 | 5.9 | 5.8 | 99.4 |
| 60-64 | 24,405,661 | 11,953,542 | 12,452,119 | 6.4 | 6.3 | 6.4 | 96 |
| 65-69 | 22,764,549 | 10,972,156 | 11,792,393 | 5.9 | 5.8 | 6.1 | 93 |
| 70-74 | 18,619,654 | 8,749,363 | 9,870,291 | 4.8 | 4.6 | 5.1 | 88.6 |
| 75-79 | 14,600,717 | 6,679,006 | 7,921,711 | 3.8 | 3.5 | 4.1 | 84.3 |
| 80-84 | 9,091,474 | 3,924,897 | 5,166,577 | 2.4 | 2.1 | 2.7 | 76 |
| 85-89 | 4,994,455 | 2,029,872 | 2,964,583 | 1.3 | 1.1 | 1.5 | 68.5 |
| 90-94 | 2,368,468 | 834,966 | 1,533,502 | 0.6 | 0.4 | 0.8 | 54.4 |
| 95-99 | 762,774 | 218,327 | 544,447 | 0.2 | 0.1 | 0.3 | 40.1 |
| 100+ | 134,962 | 29,543 | 105,419 | 0 | 0 | 0.1 | 28 |
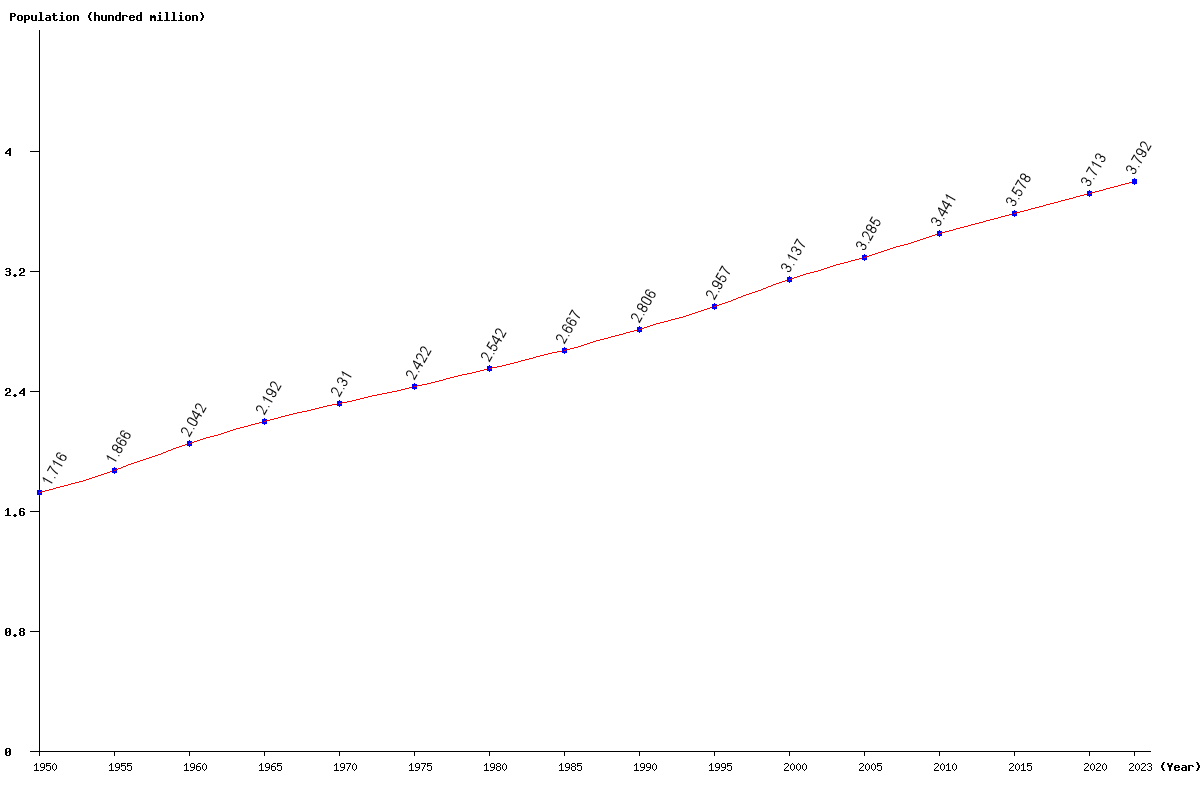
| Year | Population | Yearly % Change |
Yearly Change |
Sex ratio | Density (P/Km²) |
|---|---|---|---|---|---|
| 2024 | 381,735,513 | 0.68 | 2,576,973 | 98.37 | 20.47 |
| 2023 | 379,158,540 | 0.69 | 2,608,756 | 98.37 | 20.33 |
| 2022 | 376,549,784 | 0.70 | 2,632,181 | 98.37 | 20.19 |
| 2021 | 373,917,603 | 0.71 | 2,648,994 | 98.36 | 20.05 |
| 2020 | 371,268,609 | 0.72 | 2,666,558 | 98.36 | 19.91 |
| 2019 | 368,602,051 | 0.73 | 2,684,073 | 98.36 | 19.76 |
| 2018 | 365,917,978 | 0.74 | 2,693,972 | 98.36 | 19.62 |
| 2017 | 363,224,006 | 0.75 | 2,694,682 | 98.35 | 19.47 |
| 2016 | 360,529,324 | 0.75 | 2,691,288 | 98.33 | 19.33 |
| 2015 | 357,838,036 | 0.75 | 2,676,743 | 98.30 | 19.19 |
| 2014 | 355,161,293 | 0.76 | 2,669,449 | 98.24 | 19.04 |
| 2013 | 352,491,844 | 0.77 | 2,698,430 | 98.17 | 18.90 |
| 2012 | 349,793,414 | 0.80 | 2,776,848 | 98.09 | 18.75 |
| 2011 | 347,016,566 | 0.84 | 2,887,449 | 98.01 | 18.61 |
| 2010 | 344,129,117 | 0.89 | 3,023,356 | 97.95 | 18.45 |
| 2005 | 328,524,304 | 4.72 | 14,800,180 | 97.79 | 17.61 |
| 2000 | 313,724,124 | 6.10 | 18,024,314 | 97.44 | 16.82 |
| 1995 | 295,699,810 | 5.37 | 15,066,747 | 96.91 | 15.85 |
| 1990 | 280,633,063 | 5.24 | 13,975,114 | 96.42 | 15.05 |
| 1985 | 266,657,949 | 4.89 | 12,440,788 | 96.39 | 14.30 |
| 1980 | 254,217,161 | 4.96 | 12,002,532 | 96.40 | 13.63 |
| 1975 | 242,214,629 | 4.84 | 11,185,804 | 97.02 | 12.99 |
| 1970 | 231,028,825 | 5.40 | 11,839,486 | 97.32 | 12.39 |
| 1965 | 219,189,339 | 7.36 | 15,022,478 | 98.10 | 11.75 |
| 1960 | 204,166,861 | 9.41 | 17,565,296 | 98.71 | 10.95 |
| 1955 | 186,601,565 | 8.73 | 14,986,697 | 99.23 | 10.00 |
| 1950 | 171,614,868 | 100.06 | 9.20 |