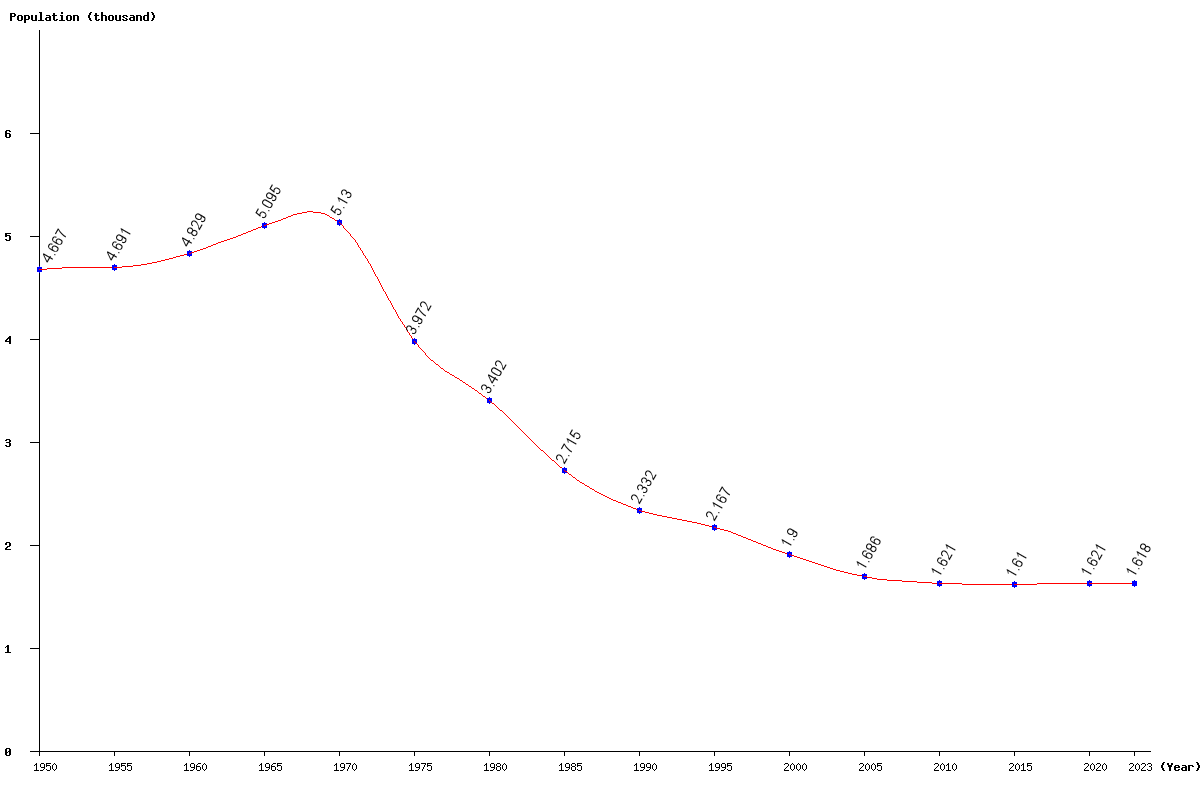
Niue population
1,190
Births this year: 0
Births today 0
Deaths this year 0
Deaths today 0
1,190
| Region Name | Percents | Number |
|---|---|---|
| Ekalesia Niue (Congregational Christian Church of Niue - a Protestant church founded by missionaries from the London Missionary Society) | 67% | 797 people |
| other Protestant (includes Seventh Day Adventist, Presbyterian, and Methodist) | 3% | 36 people |
| Mormon | 10% | 119 people |
| Roman Catholic | 10% | 119 people |
| other | 10% | 119 people |
| Ethnic groups Name | Percents | Number |
|---|---|---|
| Niuen | 66.5% | 791 people |
| part-Niuen | 13.4% | 159 people |
| non-Niuen (European and Asian and Pacific Islanders) | 20.1% | 239 people |
| Year | Population | Yearly % Change |
Yearly Change |
Sex ratio | Density (P/Km²) |
|---|---|---|---|---|---|
| 2024 | 1,618 | 0.00 | 0 | 99.68 | 6.22 |
| 2023 | 1,618 | -0.06 | -1 | 99.66 | 6.22 |
| 2022 | 1,619 | -0.12 | -2 | 99.63 | 6.23 |
| 2021 | 1,621 | 0.00 | 0 | 99.61 | 6.23 |
| 2020 | 1,621 | 0.12 | 2 | 99.58 | 6.23 |
| 2019 | 1,619 | 0.12 | 2 | 99.55 | 6.23 |
| 2018 | 1,617 | 0.19 | 3 | 99.52 | 6.22 |
| 2017 | 1,614 | 0.12 | 2 | 99.49 | 6.21 |
| 2016 | 1,612 | 0.12 | 2 | 99.45 | 6.20 |
| 2015 | 1,610 | 0.00 | 0 | 99.42 | 6.19 |
| 2014 | 1,610 | 0.00 | 0 | 99.38 | 6.19 |
| 2013 | 1,610 | -0.19 | -3 | 99.35 | 6.19 |
| 2012 | 1,613 | -0.19 | -3 | 99.31 | 6.20 |
| 2011 | 1,616 | -0.31 | -5 | 99.28 | 6.22 |
| 2010 | 1,621 | -0.37 | -6 | 99.25 | 6.23 |
| 2005 | 1,686 | -11.26 | -214 | 99.17 | 6.48 |
| 2000 | 1,900 | -12.32 | -267 | 99.16 | 7.31 |
| 1995 | 2,167 | -7.08 | -165 | 99.35 | 8.33 |
| 1990 | 2,332 | -14.11 | -383 | 99.71 | 8.97 |
| 1985 | 2,715 | -20.19 | -687 | 100.11 | 10.44 |
| 1980 | 3,402 | -14.35 | -570 | 100.57 | 13.08 |
| 1975 | 3,972 | -22.57 | -1,158 | 101.12 | 15.28 |
| 1970 | 5,130 | 0.69 | 35 | 101.78 | 19.73 |
| 1965 | 5,095 | 5.51 | 266 | 102.53 | 19.60 |
| 1960 | 4,829 | 2.94 | 138 | 103.44 | 18.57 |
| 1955 | 4,691 | 0.51 | 24 | 104.54 | 18.04 |
| 1950 | 4,667 | 105.87 | 17.95 |
