Moldova population
3,482,812
Births this year: 408,181
Births today 73
Deaths this year 435,855
Deaths today 78
3,482,812
| Region Name | Percents | Number |
|---|---|---|
| Orthodox | 93.3% | 3,275,283 people |
| Baptist | 1% | 35,105 people |
| other Christian | 1.2% | 42,126 people |
| other | 0.9% | 31,594 people |
| atheist | 0.4% | 14,042 people |
| none | 1% | 35,105 people |
| unspecified | 2.2% | 77,231 people |
| Ethnic groups Name | Percents | Number |
|---|---|---|
| Moldovan | 75.8% | 2,660,948 people |
| Ukrainian | 8.4% | 294,881 people |
| Russian | 5.9% | 207,119 people |
| Gagauz | 4.4% | 154,461 people |
| Romanian | 2.2% | 77,231 people |
| Bulgarian | 1.9% | 66,699 people |
| other | 1% | 35,105 people |
| unspecified | 0.4% | 14,042 people |
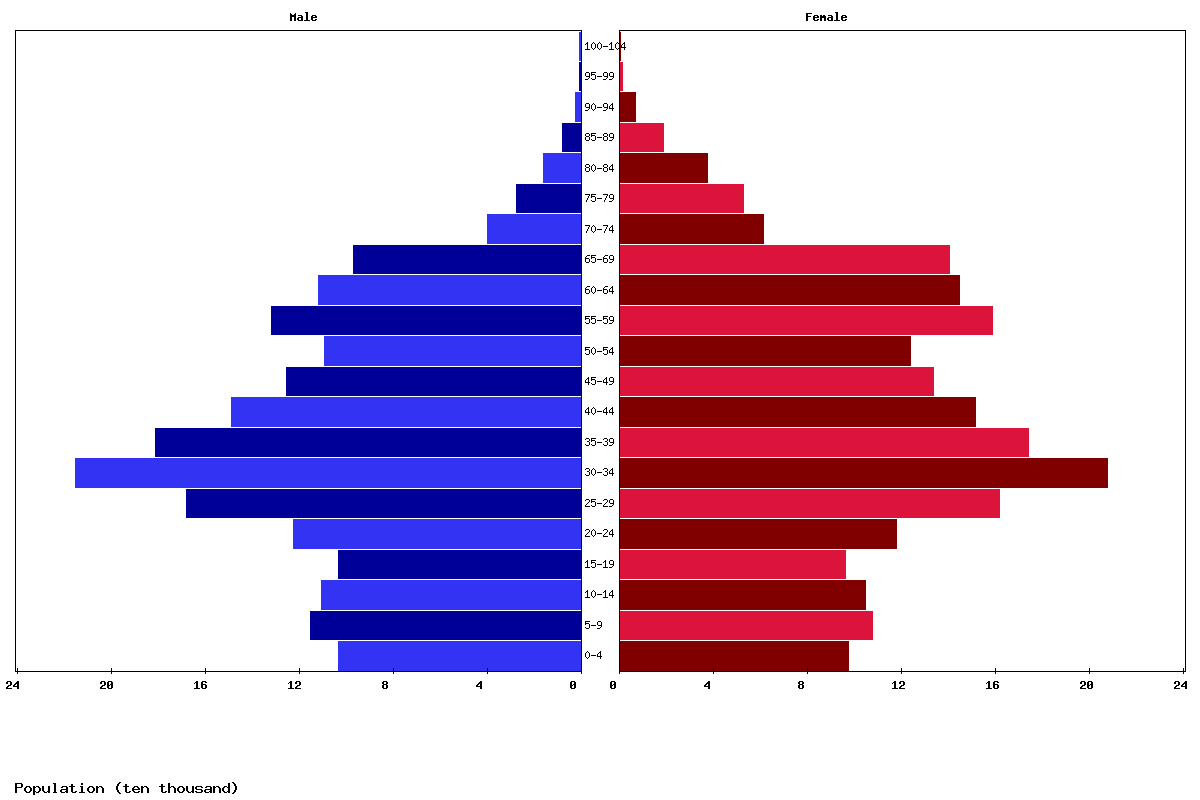
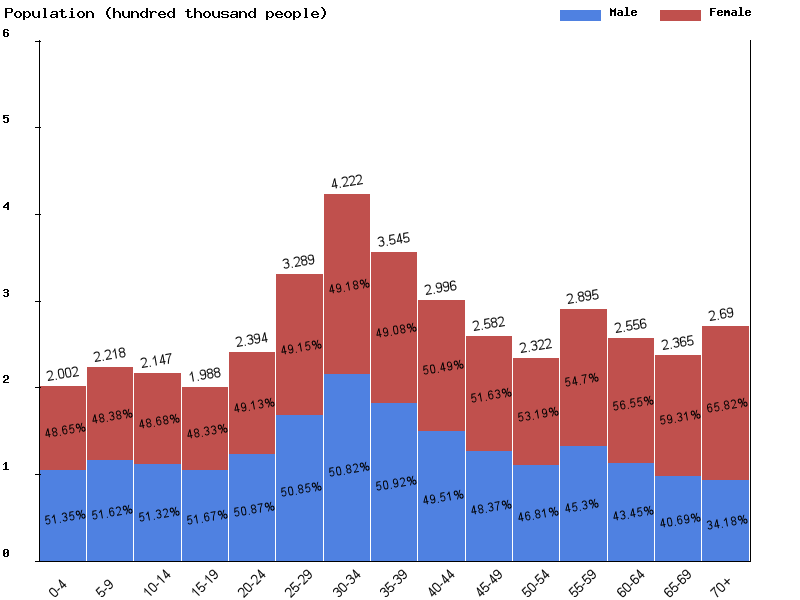
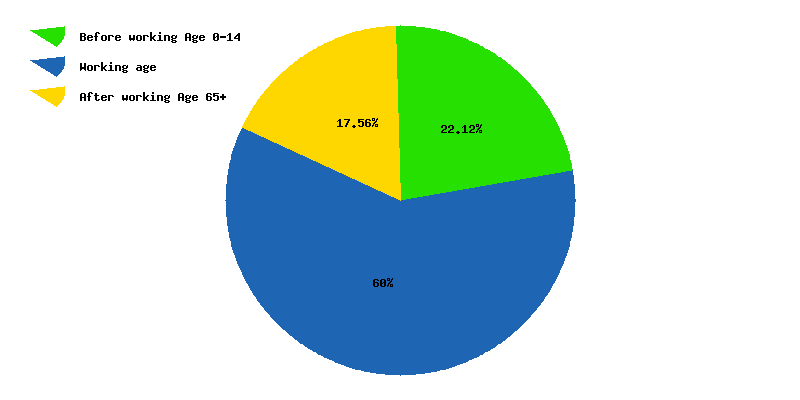
| Age | Both Sexes Population | Male Population | Female Population | Both Sexes (%) | Male (%) | Female (%) | Sex ratio (female/male) |
|---|---|---|---|---|---|---|---|
| Total | 3,944,590 | 1,883,341 | 2,061,249 | 100 | 100 | 100 | 91.4 |
| 00-04 | 176,910 | 90,854 | 86,056 | 4.5 | 4.8 | 4.2 | 105.6 |
| 05-09 | 199,184 | 102,243 | 96,941 | 5 | 5.4 | 4.7 | 105.5 |
| 10-14 | 220,460 | 113,791 | 106,669 | 5.6 | 6 | 5.2 | 106.7 |
| 15-19 | 212,266 | 108,937 | 103,329 | 5.4 | 5.8 | 5 | 105.4 |
| 20-24 | 195,844 | 101,184 | 94,660 | 5 | 5.4 | 4.6 | 106.9 |
| 25-29 | 236,589 | 120,152 | 116,437 | 6 | 6.4 | 5.6 | 103.2 |
| 30-34 | 325,817 | 165,328 | 160,489 | 8.3 | 8.8 | 7.8 | 103 |
| 35-39 | 417,512 | 211,287 | 206,225 | 10.6 | 11.2 | 10 | 102.5 |
| 40-44 | 348,977 | 176,530 | 172,447 | 8.8 | 9.4 | 8.4 | 102.4 |
| 45-49 | 292,616 | 143,433 | 149,183 | 7.4 | 7.6 | 7.2 | 96.1 |
| 50-54 | 248,934 | 118,338 | 130,596 | 6.3 | 6.3 | 6.3 | 90.6 |
| 55-59 | 220,131 | 100,396 | 119,735 | 5.6 | 5.3 | 5.8 | 83.8 |
| 60-64 | 265,880 | 115,816 | 150,064 | 6.7 | 6.1 | 7.3 | 77.2 |
| 65-69 | 225,727 | 92,513 | 133,214 | 5.7 | 4.9 | 6.5 | 69.4 |
| 70-74 | 197,344 | 73,872 | 123,472 | 5 | 3.9 | 6 | 59.8 |
| 75-79 | 74,686 | 26,168 | 48,518 | 1.9 | 1.4 | 2.4 | 53.9 |
| 80-84 | 49,714 | 14,331 | 35,383 | 1.3 | 0.8 | 1.7 | 40.5 |
| 85-89 | 25,394 | 5,996 | 19,398 | 0.6 | 0.3 | 0.9 | 30.9 |
| 90-94 | 8,667 | 1,896 | 6,771 | 0.2 | 0.1 | 0.3 | 28 |
| 95-99 | 1,785 | 259 | 1,526 | 0 | 0 | 0.1 | 17 |
| 100+ | 153 | 17 | 136 | 0 | 0 | 0 | 12.5 |
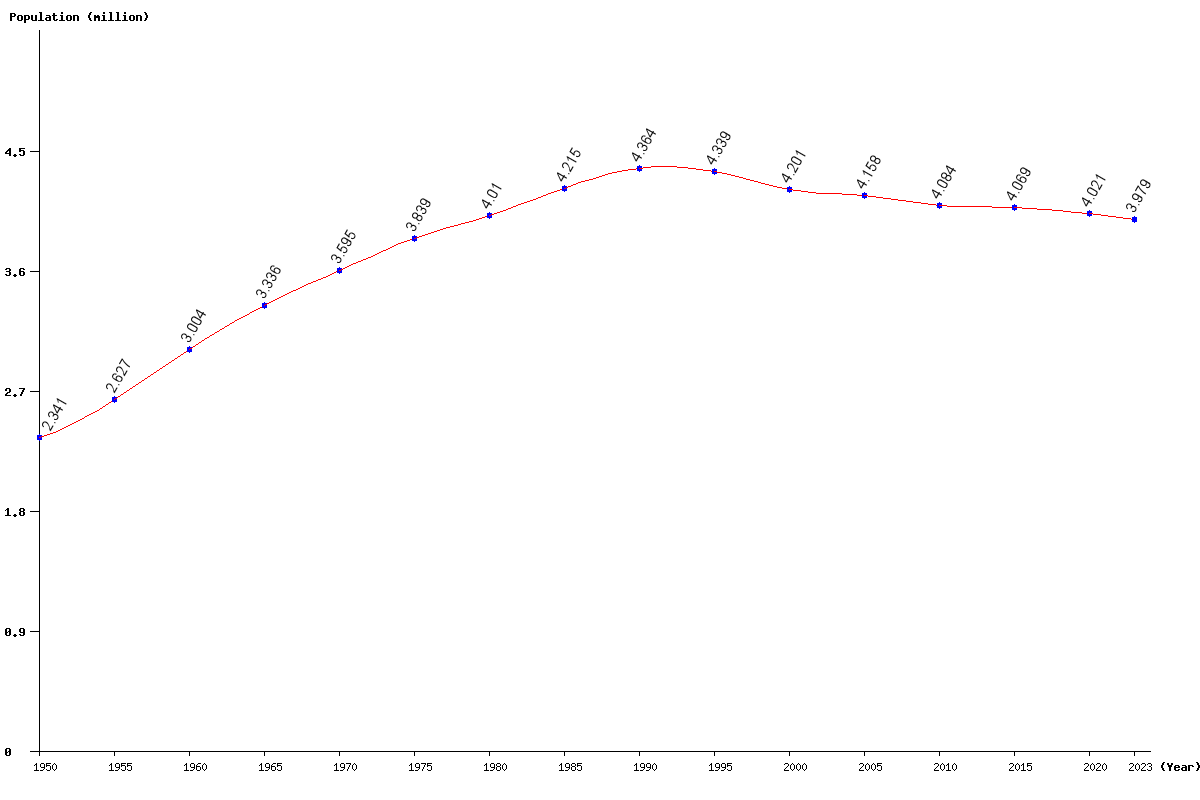
| Year | Population | Yearly % Change |
Yearly Change |
Sex ratio | Density (P/Km²) |
|---|---|---|---|---|---|
| 2025 | 3,944,590 | -0.45 | -17,649 | 91.37 | 120.08 |
| 2024 | 3,962,239 | -0.41 | -16,415 | 91.49 | 120.62 |
| 2023 | 3,978,654 | -0.38 | -15,225 | 91.61 | 121.12 |
| 2022 | 3,993,879 | -0.35 | -14,097 | 91.73 | 121.58 |
| 2021 | 4,007,976 | -0.32 | -13,012 | 91.86 | 122.01 |
| 2020 | 4,020,988 | -0.30 | -12,179 | 91.98 | 122.40 |
| 2019 | 4,033,167 | -0.28 | -11,367 | 92.11 | 122.78 |
| 2018 | 4,044,534 | -0.25 | -10,106 | 92.24 | 123.12 |
| 2017 | 4,054,640 | -0.20 | -8,222 | 92.37 | 123.43 |
| 2016 | 4,062,862 | -0.15 | -6,035 | 92.48 | 123.68 |
| 2015 | 4,068,897 | -0.08 | -3,443 | 92.56 | 123.86 |
| 2014 | 4,072,340 | -0.03 | -1,374 | 92.63 | 123.97 |
| 2013 | 4,073,714 | -0.03 | -1,040 | 92.67 | 124.01 |
| 2012 | 4,074,754 | -0.07 | -3,057 | 92.68 | 124.04 |
| 2011 | 4,077,811 | -0.16 | -6,672 | 92.66 | 124.13 |
| 2010 | 4,084,483 | -0.28 | -11,330 | 92.60 | 124.34 |
| 2005 | 4,157,707 | -1.03 | -43,381 | 91.91 | 126.57 |
| 2000 | 4,201,088 | -3.18 | -137,994 | 91.80 | 127.89 |
| 1995 | 4,339,082 | -0.57 | -25,032 | 91.44 | 132.09 |
| 1990 | 4,364,114 | 3.54 | 149,203 | 91.07 | 132.85 |
| 1985 | 4,214,911 | 5.11 | 205,068 | 90.43 | 128.31 |
| 1980 | 4,009,843 | 4.45 | 170,932 | 89.69 | 122.07 |
| 1975 | 3,838,911 | 6.80 | 244,395 | 88.64 | 116.86 |
| 1970 | 3,594,516 | 7.76 | 258,891 | 87.84 | 109.42 |
| 1965 | 3,335,625 | 11.06 | 332,068 | 87.99 | 101.54 |
| 1960 | 3,003,557 | 14.33 | 376,550 | 87.92 | 91.43 |
| 1955 | 2,627,007 | 12.22 | 286,004 | 87.63 | 79.97 |
| 1950 | 2,341,003 | 87.65 | 71.26 |