Mayotte population
0
Births this year: 0
Births today 0
Deaths this year 0
Deaths today 0
0
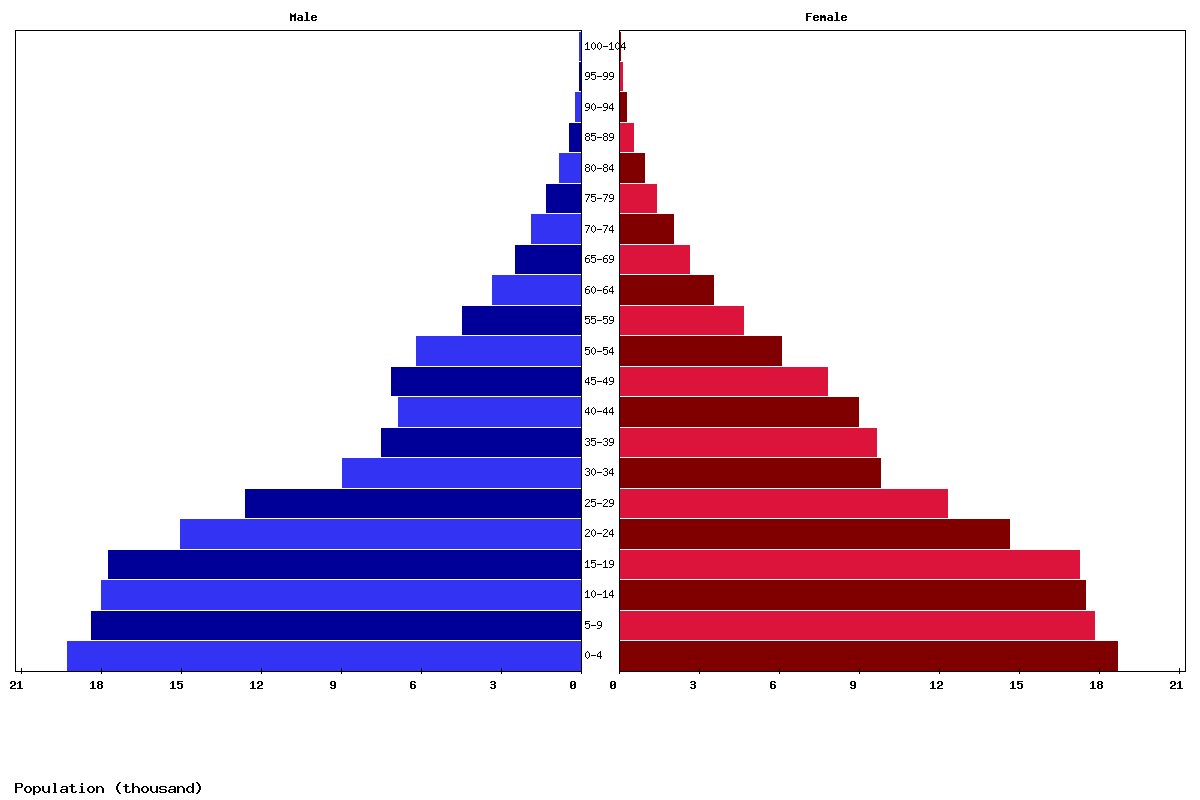
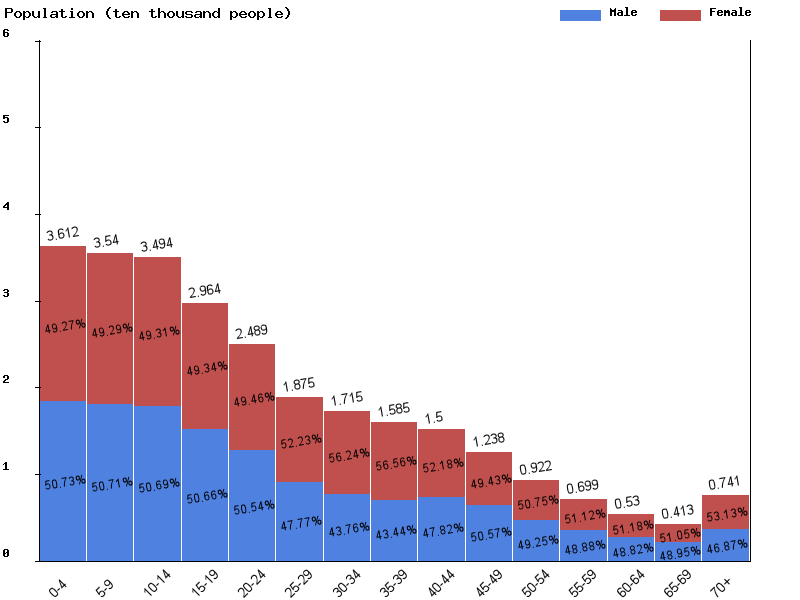
| Age | Both Sexes Population | Male Population | Female Population | Both Sexes (%) | Male (%) | Female (%) | Sex ratio (female/male) |
|---|---|---|---|---|---|---|---|
| Total | 307,699 | 151,635 | 156,064 | 100 | 100 | 100 | 97.2 |
| 00-04 | 37,892 | 19,225 | 18,667 | 12.3 | 12.7 | 12 | 103 |
| 05-09 | 36,108 | 18,316 | 17,792 | 11.7 | 12.1 | 11.4 | 102.9 |
| 10-14 | 35,387 | 17,945 | 17,442 | 11.5 | 11.8 | 11.2 | 102.9 |
| 15-19 | 34,908 | 17,689 | 17,219 | 11.3 | 11.7 | 11 | 102.7 |
| 20-24 | 29,583 | 14,970 | 14,613 | 9.6 | 9.9 | 9.4 | 102.4 |
| 25-29 | 24,828 | 12,533 | 12,295 | 8.1 | 8.3 | 7.9 | 101.9 |
| 30-34 | 18,702 | 8,923 | 9,779 | 6.1 | 5.9 | 6.3 | 91.2 |
| 35-39 | 17,083 | 7,462 | 9,621 | 5.6 | 4.9 | 6.2 | 77.6 |
| 40-44 | 15,749 | 6,823 | 8,926 | 5.1 | 4.5 | 5.7 | 76.4 |
| 45-49 | 14,840 | 7,068 | 7,772 | 4.8 | 4.7 | 5 | 90.9 |
| 50-54 | 12,186 | 6,119 | 6,067 | 4 | 4 | 3.9 | 100.9 |
| 55-59 | 9,023 | 4,401 | 4,622 | 2.9 | 2.9 | 3 | 95.2 |
| 60-64 | 6,772 | 3,280 | 3,492 | 2.2 | 2.2 | 2.2 | 93.9 |
| 65-69 | 5,043 | 2,426 | 2,617 | 1.6 | 1.6 | 1.7 | 92.7 |
| 70-74 | 3,819 | 1,826 | 1,993 | 1.2 | 1.2 | 1.3 | 91.6 |
| 75-79 | 2,621 | 1,257 | 1,364 | 0.9 | 0.8 | 0.9 | 92.2 |
| 80-84 | 1,716 | 780 | 936 | 0.6 | 0.5 | 0.6 | 83.3 |
| 85-89 | 903 | 402 | 501 | 0.3 | 0.3 | 0.3 | 80.2 |
| 90-94 | 395 | 154 | 241 | 0.1 | 0.1 | 0.2 | 63.9 |
| 95-99 | 115 | 33 | 82 | 0 | 0 | 0.1 | 40.2 |
| 100+ | 26 | 3 | 23 | 0 | 0 | 0 | 13 |

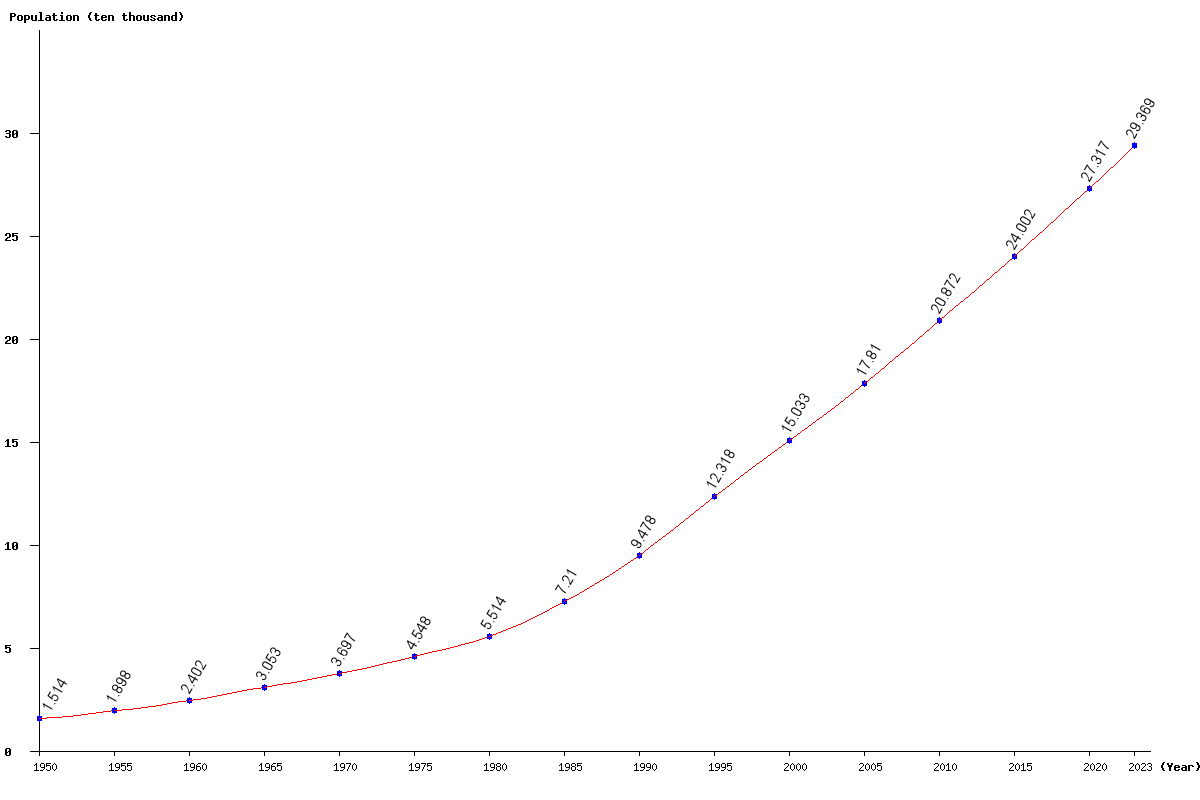
| Year | Population | Yearly % Change |
Yearly Change |
Sex ratio | Density (P/Km²) |
|---|---|---|---|---|---|
| 2025 | 307,699 | 2.34 | 7,048 | 97.16 | 820.53 |
| 2024 | 300,651 | 2.37 | 6,964 | 97.10 | 801.74 |
| 2023 | 293,687 | 2.40 | 6,892 | 97.04 | 783.17 |
| 2022 | 286,795 | 2.44 | 6,834 | 96.98 | 764.79 |
| 2021 | 279,961 | 2.49 | 6,789 | 96.91 | 746.56 |
| 2020 | 273,172 | 2.53 | 6,749 | 96.86 | 728.46 |
| 2019 | 266,423 | 2.58 | 6,706 | 96.81 | 710.46 |
| 2018 | 259,717 | 2.63 | 6,649 | 96.76 | 692.58 |
| 2017 | 253,068 | 2.67 | 6,572 | 96.71 | 674.85 |
| 2016 | 246,496 | 2.70 | 6,481 | 96.64 | 657.32 |
| 2015 | 240,015 | 2.73 | 6,380 | 96.51 | 640.04 |
| 2014 | 233,635 | 2.77 | 6,287 | 96.34 | 623.03 |
| 2013 | 227,348 | 2.82 | 6,225 | 96.11 | 606.26 |
| 2012 | 221,123 | 2.88 | 6,199 | 95.89 | 589.66 |
| 2011 | 214,924 | 2.97 | 6,201 | 95.71 | 573.13 |
| 2010 | 208,723 | 3.07 | 6,220 | 95.64 | 556.59 |
| 2005 | 178,103 | 18.48 | 27,774 | 97.18 | 474.94 |
| 2000 | 150,329 | 22.04 | 27,147 | 102.41 | 400.88 |
| 1995 | 123,182 | 29.97 | 28,402 | 103.16 | 328.49 |
| 1990 | 94,780 | 31.45 | 22,676 | 104.60 | 252.75 |
| 1985 | 72,104 | 30.77 | 16,968 | 106.51 | 192.28 |
| 1980 | 55,136 | 21.22 | 9,652 | 106.14 | 147.03 |
| 1975 | 45,484 | 23.05 | 8,519 | 107.98 | 121.29 |
| 1970 | 36,965 | 21.10 | 6,440 | 110.47 | 98.57 |
| 1965 | 30,525 | 27.09 | 6,506 | 113.63 | 81.40 |
| 1960 | 24,019 | 26.52 | 5,035 | 115.28 | 64.05 |
| 1955 | 18,984 | 25.38 | 3,843 | 116.94 | 50.62 |
| 1950 | 15,141 | 119.66 | 40.38 |