Maldives population
437,960
Births this year: 59,504
Births today 6
Deaths this year 14,504
Deaths today 2
437,960
| Region Name | Percents | Number |
|---|---|---|
| Sunni Muslim (official) | 0 people |
| Ethnic groups Name | Percents | Number |
|---|---|---|
| South Indians, Sinhalese, Arabs | 100% | 392,960 people |
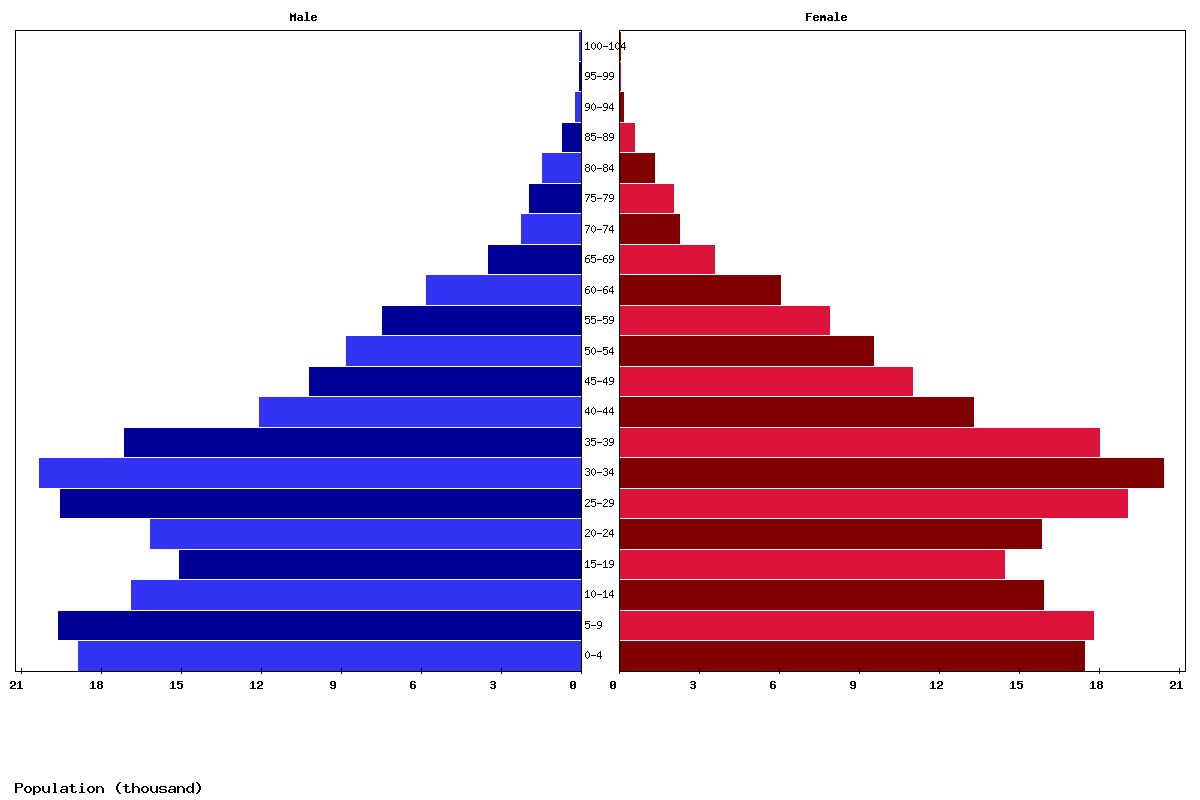
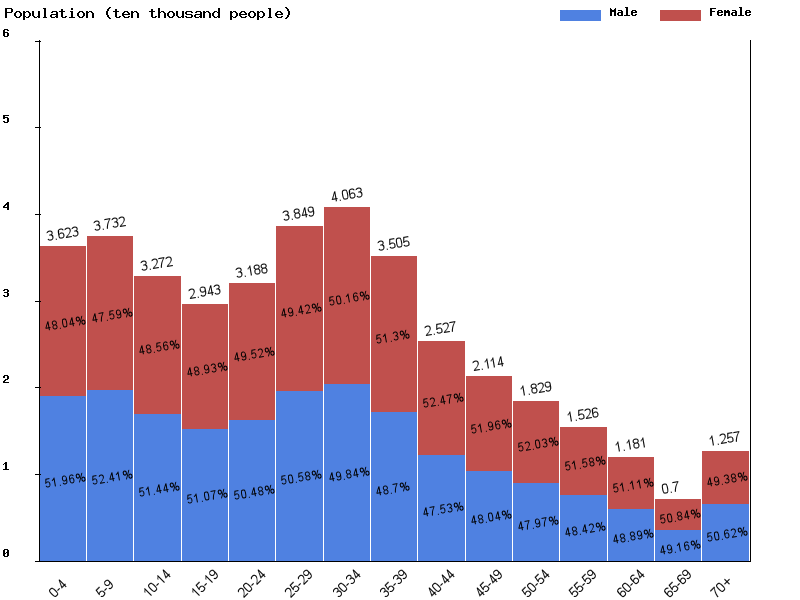
| Age | Both Sexes Population | Male Population | Female Population | Both Sexes (%) | Male (%) | Female (%) | Sex ratio (female/male) |
|---|---|---|---|---|---|---|---|
| Total | 417,479 | 209,135 | 208,344 | 100 | 100 | 100 | 100.4 |
| 00-04 | 31,891 | 16,524 | 15,367 | 7.6 | 7.9 | 7.4 | 107.5 |
| 05-09 | 36,191 | 18,804 | 17,387 | 8.7 | 9 | 8.3 | 108.1 |
| 10-14 | 37,291 | 19,543 | 17,748 | 8.9 | 9.3 | 8.5 | 110.1 |
| 15-19 | 32,335 | 16,594 | 15,741 | 7.7 | 7.9 | 7.6 | 105.4 |
| 20-24 | 28,929 | 14,569 | 14,360 | 6.9 | 7 | 6.9 | 101.5 |
| 25-29 | 31,893 | 15,934 | 15,959 | 7.6 | 7.6 | 7.7 | 99.8 |
| 30-34 | 38,784 | 19,639 | 19,145 | 9.3 | 9.4 | 9.2 | 102.6 |
| 35-39 | 40,740 | 20,311 | 20,429 | 9.8 | 9.7 | 9.8 | 99.4 |
| 40-44 | 34,883 | 16,953 | 17,930 | 8.4 | 8.1 | 8.6 | 94.6 |
| 45-49 | 25,203 | 11,969 | 13,234 | 6 | 5.7 | 6.4 | 90.4 |
| 50-54 | 21,034 | 10,105 | 10,929 | 5 | 4.8 | 5.2 | 92.5 |
| 55-59 | 17,918 | 8,568 | 9,350 | 4.3 | 4.1 | 4.5 | 91.6 |
| 60-64 | 14,689 | 7,075 | 7,614 | 3.5 | 3.4 | 3.7 | 92.9 |
| 65-69 | 11,022 | 5,350 | 5,672 | 2.6 | 2.6 | 2.7 | 94.3 |
| 70-74 | 6,180 | 3,004 | 3,176 | 1.5 | 1.4 | 1.5 | 94.6 |
| 75-79 | 3,488 | 1,716 | 1,772 | 0.8 | 0.8 | 0.9 | 96.8 |
| 80-84 | 2,740 | 1,324 | 1,416 | 0.7 | 0.6 | 0.7 | 93.5 |
| 85-89 | 1,603 | 805 | 798 | 0.4 | 0.4 | 0.4 | 100.9 |
| 90-94 | 550 | 291 | 259 | 0.1 | 0.1 | 0.1 | 112.4 |
| 95-99 | 101 | 51 | 50 | 0 | 0 | 0 | 102 |
| 100+ | 14 | 6 | 8 | 0 | 0 | 0 | 75 |


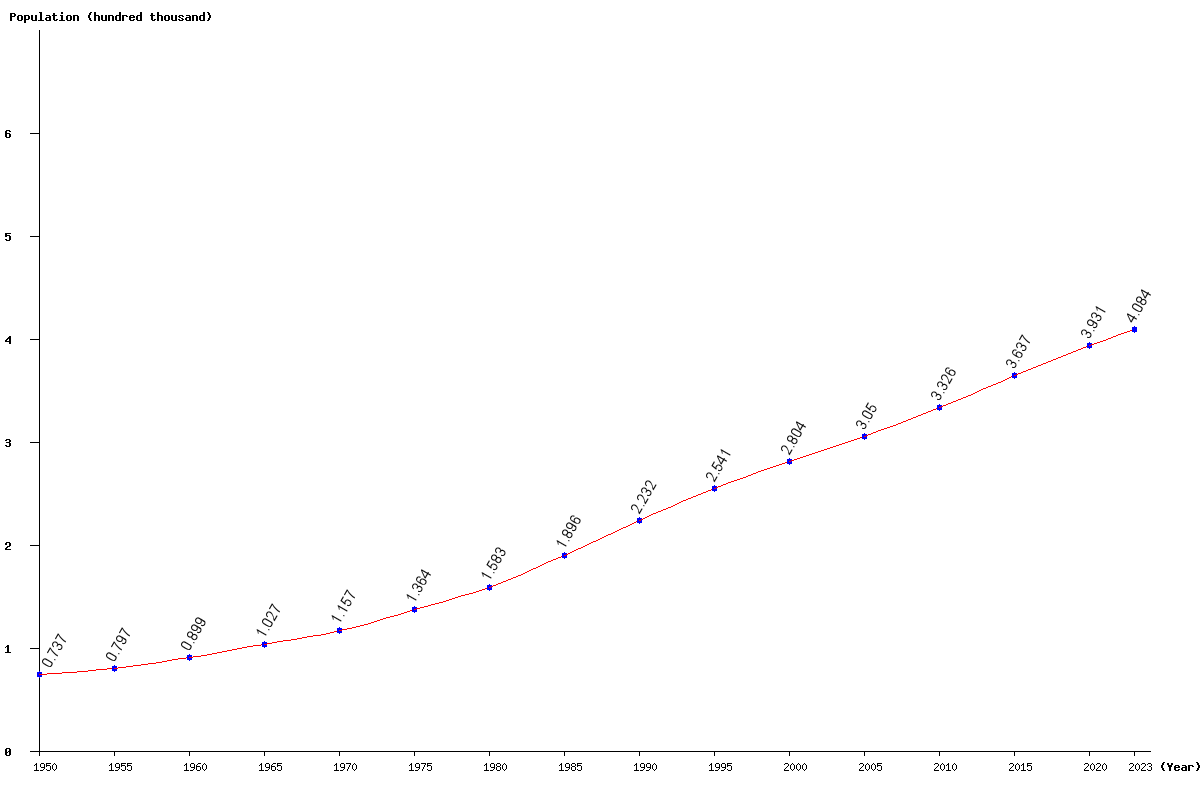
| Year | Population | Yearly % Change |
Yearly Change |
Sex ratio | Density (P/Km²) |
|---|---|---|---|---|---|
| 2024 | 413,038 | 1.14 | 4,653 | 100.40 | 1,376.79 |
| 2023 | 408,385 | 1.21 | 4,875 | 100.43 | 1,361.28 |
| 2022 | 403,510 | 1.28 | 5,102 | 100.46 | 1,345.03 |
| 2021 | 398,408 | 1.36 | 5,328 | 100.48 | 1,328.03 |
| 2020 | 393,080 | 1.43 | 5,547 | 100.50 | 1,310.27 |
| 2019 | 387,533 | 1.51 | 5,747 | 100.53 | 1,291.78 |
| 2018 | 381,786 | 1.57 | 5,919 | 100.55 | 1,272.62 |
| 2017 | 375,867 | 1.64 | 6,055 | 100.58 | 1,252.89 |
| 2016 | 369,812 | 1.69 | 6,155 | 100.59 | 1,232.71 |
| 2015 | 363,657 | 1.75 | 6,242 | 100.59 | 1,212.19 |
| 2014 | 357,415 | 1.80 | 6,304 | 100.59 | 1,191.38 |
| 2013 | 351,111 | 1.83 | 6,294 | 100.57 | 1,170.37 |
| 2012 | 344,817 | 1.83 | 6,199 | 100.55 | 1,149.39 |
| 2011 | 338,618 | 1.82 | 6,043 | 100.55 | 1,128.73 |
| 2010 | 332,575 | 1.79 | 5,862 | 100.57 | 1,108.58 |
| 2005 | 304,968 | 8.77 | 24,584 | 101.13 | 1,016.56 |
| 2000 | 280,384 | 10.36 | 26,314 | 102.54 | 934.61 |
| 1995 | 254,070 | 13.84 | 30,891 | 102.56 | 846.90 |
| 1990 | 223,179 | 17.74 | 33,628 | 105.18 | 743.93 |
| 1985 | 189,551 | 19.76 | 31,269 | 108.48 | 631.84 |
| 1980 | 158,282 | 16.01 | 21,848 | 109.56 | 527.61 |
| 1975 | 136,434 | 17.92 | 20,731 | 110.78 | 454.78 |
| 1970 | 115,703 | 12.64 | 12,980 | 106.95 | 385.68 |
| 1965 | 102,723 | 14.30 | 12,848 | 114.64 | 342.41 |
| 1960 | 89,875 | 12.76 | 10,171 | 119.53 | 299.58 |
| 1955 | 79,704 | 8.12 | 5,989 | 124.65 | 265.68 |
| 1950 | 73,715 | 130.03 | 245.72 |
