Latvia population
1,887,627
Births this year: 171,731
Births today 0
Deaths this year 249,790
Deaths today 1
1,887,627
| Region Name | Percents | Number |
|---|---|---|
| Lutheran | 19.6% | 385,274 people |
| Orthodox | 15.3% | 300,750 people |
| other Christian | 1% | 19,657 people |
| other | 0.4% | 7,863 people |
| unspecified | 63.7% | 1,252,142 people |
| Ethnic groups Name | Percents | Number |
|---|---|---|
| Latvian | 61.1% | 1,201,034 people |
| Russian | 26.2% | 515,010 people |
| Belarusian | 3.5% | 68,799 people |
| Ukrainian | 2.3% | 45,211 people |
| Polish | 2.2% | 43,245 people |
| Lithuanian | 1.3% | 25,554 people |
| other | 3.4% | 66,833 people |
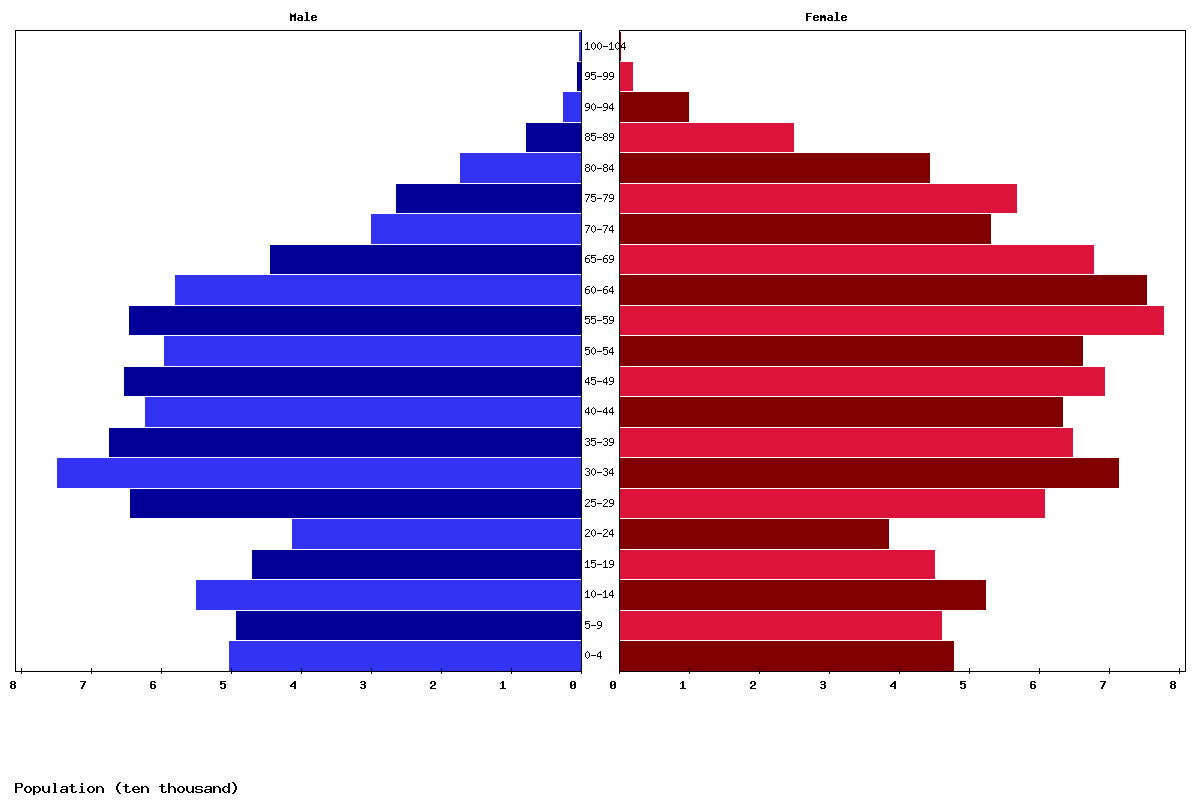
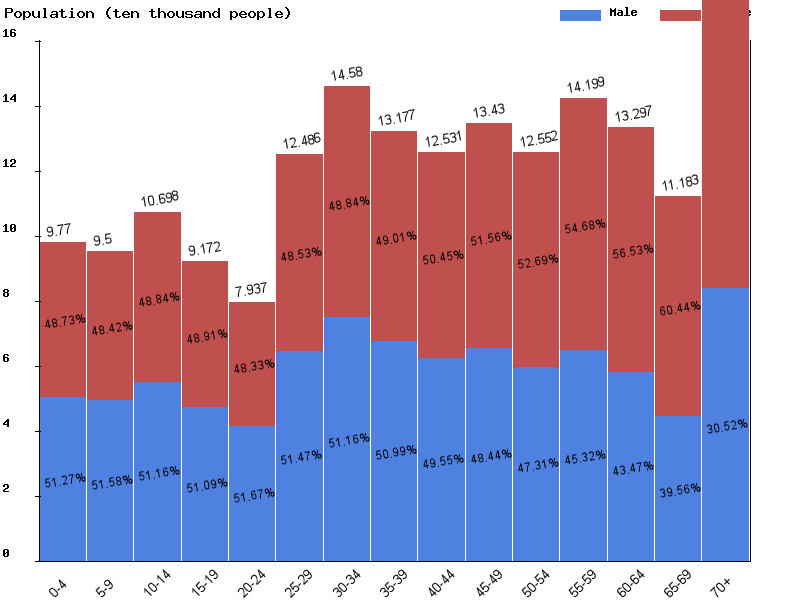
| Age | Both Sexes Population | Male Population | Female Population | Both Sexes (%) | Male (%) | Female (%) | Sex ratio (female/male) |
|---|---|---|---|---|---|---|---|
| Total | 1,864,854 | 863,523 | 1,001,331 | 100 | 100 | 100 | 86.2 |
| 00-04 | 93,093 | 47,735 | 45,358 | 5 | 5.5 | 4.5 | 105.2 |
| 05-09 | 97,599 | 50,034 | 47,565 | 5.2 | 5.8 | 4.8 | 105.2 |
| 10-14 | 94,917 | 48,954 | 45,963 | 5.1 | 5.7 | 4.6 | 106.5 |
| 15-19 | 106,811 | 54,622 | 52,189 | 5.7 | 6.3 | 5.2 | 104.7 |
| 20-24 | 91,417 | 46,653 | 44,764 | 4.9 | 5.4 | 4.5 | 104.2 |
| 25-29 | 78,991 | 40,744 | 38,247 | 4.2 | 4.7 | 3.8 | 106.5 |
| 30-34 | 124,052 | 63,649 | 60,403 | 6.7 | 7.4 | 6 | 105.4 |
| 35-39 | 144,445 | 73,560 | 70,885 | 7.7 | 8.5 | 7.1 | 103.8 |
| 40-44 | 129,980 | 65,854 | 64,126 | 7 | 7.6 | 6.4 | 102.7 |
| 45-49 | 122,778 | 60,218 | 62,560 | 6.6 | 7 | 6.2 | 96.3 |
| 50-54 | 130,193 | 62,029 | 68,164 | 7 | 7.2 | 6.8 | 91 |
| 55-59 | 119,990 | 55,395 | 64,595 | 6.4 | 6.4 | 6.5 | 85.8 |
| 60-64 | 132,671 | 57,886 | 74,785 | 7.1 | 6.7 | 7.5 | 77.4 |
| 65-69 | 120,519 | 49,536 | 70,983 | 6.5 | 5.7 | 7.1 | 69.8 |
| 70-74 | 97,936 | 35,820 | 62,116 | 5.3 | 4.1 | 6.2 | 57.7 |
| 75-79 | 67,965 | 22,192 | 45,773 | 3.6 | 2.6 | 4.6 | 48.5 |
| 80-84 | 60,087 | 16,864 | 43,223 | 3.2 | 2 | 4.3 | 39 |
| 85-89 | 35,383 | 8,592 | 26,791 | 1.9 | 1 | 2.7 | 32.1 |
| 90-94 | 13,029 | 2,678 | 10,351 | 0.7 | 0.3 | 1 | 25.9 |
| 95-99 | 2,776 | 477 | 2,299 | 0.1 | 0.1 | 0.2 | 20.7 |
| 100+ | 222 | 31 | 191 | 0 | 0 | 0 | 16.2 |


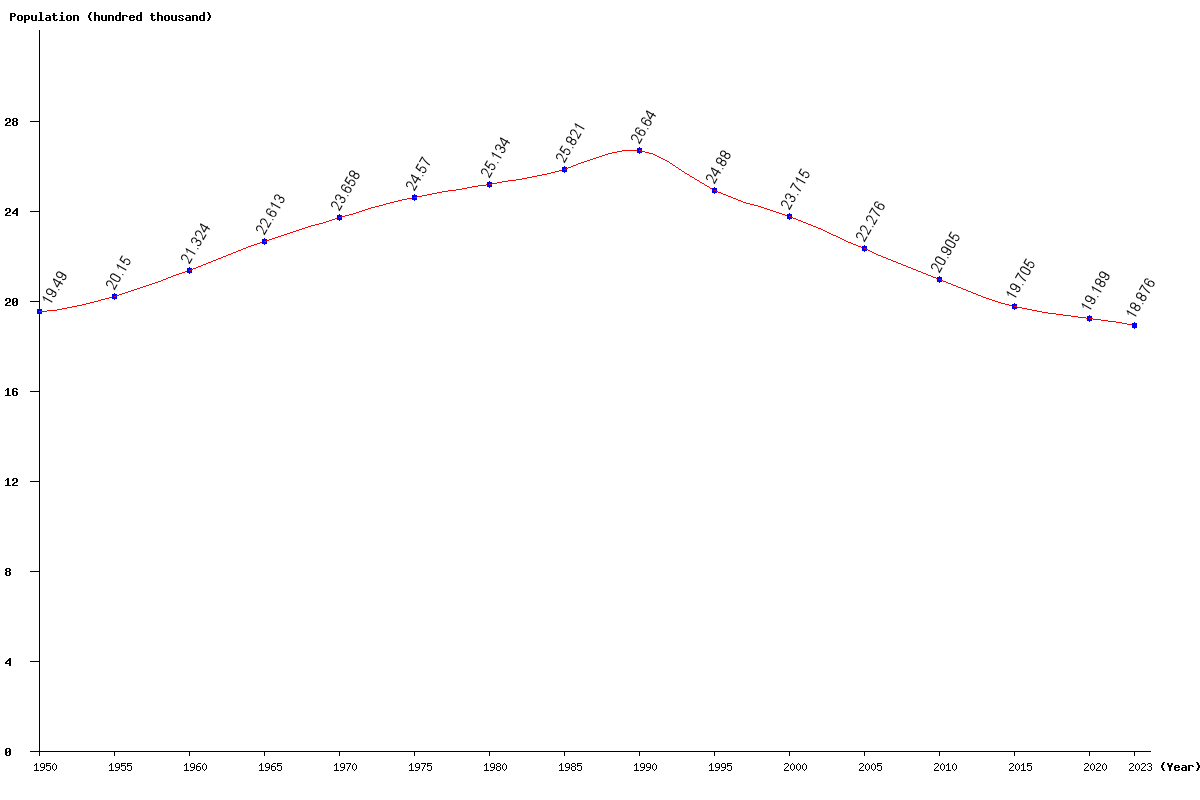
| Year | Population | Yearly % Change |
Yearly Change |
Sex ratio | Density (P/Km²) |
|---|---|---|---|---|---|
| 2024 | 1,876,225 | -0.60 | -11,378 | 86.08 | 30.16 |
| 2023 | 1,887,603 | -0.59 | -11,118 | 85.92 | 30.35 |
| 2022 | 1,898,721 | -0.55 | -10,498 | 85.76 | 30.53 |
| 2021 | 1,909,219 | -0.51 | -9,730 | 85.61 | 30.69 |
| 2020 | 1,918,949 | -0.45 | -8,720 | 85.46 | 30.85 |
| 2019 | 1,927,669 | -0.42 | -8,111 | 85.31 | 30.99 |
| 2018 | 1,935,780 | -0.45 | -8,785 | 85.18 | 31.12 |
| 2017 | 1,944,565 | -0.57 | -11,177 | 85.05 | 31.26 |
| 2016 | 1,955,742 | -0.75 | -14,761 | 84.91 | 31.44 |
| 2015 | 1,970,503 | -0.95 | -18,851 | 84.76 | 31.68 |
| 2014 | 1,989,354 | -1.12 | -22,503 | 84.60 | 31.98 |
| 2013 | 2,011,857 | -1.24 | -25,233 | 84.43 | 32.34 |
| 2012 | 2,037,090 | -1.29 | -26,571 | 84.28 | 32.75 |
| 2011 | 2,063,661 | -1.28 | -26,858 | 84.17 | 33.18 |
| 2010 | 2,090,519 | -1.27 | -26,788 | 84.12 | 33.61 |
| 2005 | 2,227,559 | -6.07 | -143,922 | 84.62 | 35.81 |
| 2000 | 2,371,481 | -4.68 | -116,507 | 85.21 | 38.13 |
| 1995 | 2,487,988 | -6.61 | -175,997 | 85.58 | 40.00 |
| 1990 | 2,663,985 | 3.17 | 81,906 | 86.86 | 42.83 |
| 1985 | 2,582,079 | 2.73 | 68,682 | 85.82 | 41.51 |
| 1980 | 2,513,397 | 2.29 | 56,370 | 85.22 | 40.41 |
| 1975 | 2,457,027 | 3.86 | 91,274 | 85.07 | 39.50 |
| 1970 | 2,365,753 | 4.62 | 104,494 | 84.15 | 38.03 |
| 1965 | 2,261,259 | 6.04 | 128,891 | 82.09 | 36.35 |
| 1960 | 2,132,368 | 5.82 | 117,359 | 79.20 | 34.28 |
| 1955 | 2,015,009 | 3.39 | 66,009 | 78.19 | 32.40 |
| 1950 | 1,949,000 | 76.17 | 31.33 |
