Japan population
124,709,119
Births this year: 8,636,394
Births today 1,835
Deaths this year 10,629,408
Deaths today 2,258
124,709,119
| Region Name | Percents | Number |
|---|---|---|
| Shintoism | 79.2% | 100,348,089 people |
| Buddhism | 66.8% | 84,637,025 people |
| Christianity | 1.5% | 1,900,532 people |
| other | 7.1% | 8,995,851 people |
| Ethnic groups Name | Percents | Number |
|---|---|---|
| Japanese | 98.5% | 124,801,601 people |
| Koreans | 0.5% | 633,511 people |
| Chinese | 0.4% | 506,809 people |
| other | 0.6% | 760,213 people |
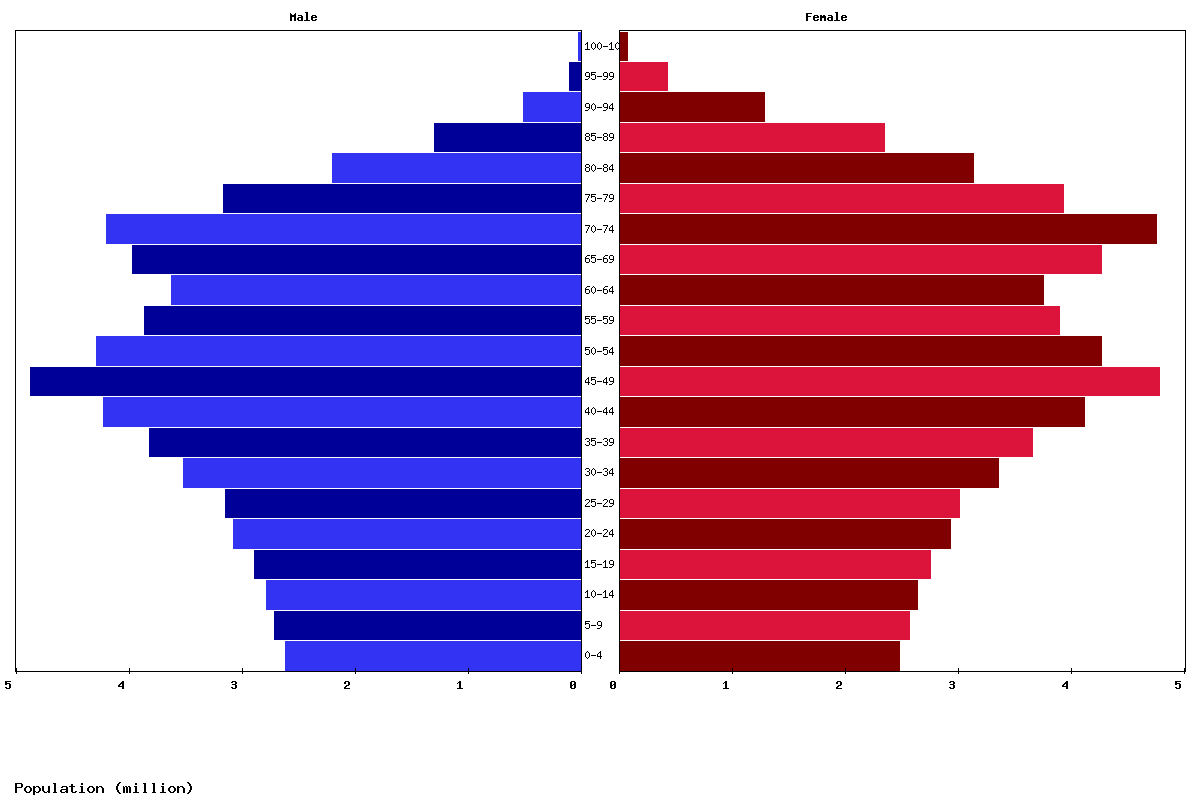
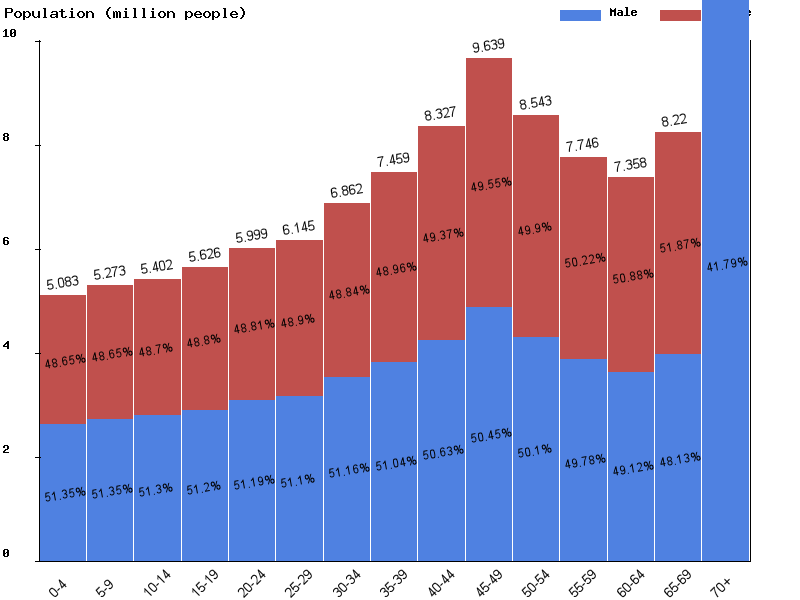
| Age | Both Sexes Population | Male Population | Female Population | Both Sexes (%) | Male (%) | Female (%) | Sex ratio (female/male) |
|---|---|---|---|---|---|---|---|
| Total | 122,839,664 | 59,565,063 | 63,274,601 | 100 | 100 | 100 | 94.1 |
| 00-04 | 4,872,732 | 2,502,201 | 2,370,531 | 4 | 4.2 | 3.7 | 105.6 |
| 05-09 | 5,086,975 | 2,612,047 | 2,474,928 | 4.1 | 4.4 | 3.9 | 105.5 |
| 10-14 | 5,275,897 | 2,708,793 | 2,567,104 | 4.3 | 4.5 | 4.1 | 105.5 |
| 15-19 | 5,425,060 | 2,782,141 | 2,642,919 | 4.4 | 4.7 | 4.2 | 105.3 |
| 20-24 | 5,665,781 | 2,899,075 | 2,766,706 | 4.6 | 4.9 | 4.4 | 104.8 |
| 25-29 | 6,033,351 | 3,085,458 | 2,947,893 | 4.9 | 5.2 | 4.7 | 104.7 |
| 30-34 | 6,166,461 | 3,148,484 | 3,017,977 | 5 | 5.3 | 4.8 | 104.3 |
| 35-39 | 6,868,725 | 3,511,332 | 3,357,393 | 5.6 | 5.9 | 5.3 | 104.6 |
| 40-44 | 7,446,336 | 3,795,987 | 3,650,349 | 6.1 | 6.4 | 5.8 | 104 |
| 45-49 | 8,289,040 | 4,189,409 | 4,099,631 | 6.7 | 7 | 6.5 | 102.2 |
| 50-54 | 9,556,244 | 4,806,842 | 4,749,402 | 7.8 | 8.1 | 7.5 | 101.2 |
| 55-59 | 8,425,830 | 4,199,707 | 4,226,123 | 6.9 | 7.1 | 6.7 | 99.4 |
| 60-64 | 7,577,456 | 3,736,983 | 3,840,473 | 6.2 | 6.3 | 6.1 | 97.3 |
| 65-69 | 7,111,085 | 3,438,871 | 3,672,214 | 5.8 | 5.8 | 5.8 | 93.6 |
| 70-74 | 7,810,061 | 3,671,795 | 4,138,266 | 6.4 | 6.2 | 6.5 | 88.7 |
| 75-79 | 8,212,023 | 3,703,660 | 4,508,363 | 6.7 | 6.2 | 7.1 | 82.2 |
| 80-84 | 6,065,908 | 2,521,769 | 3,544,139 | 4.9 | 4.2 | 5.6 | 71.2 |
| 85-89 | 3,985,173 | 1,456,595 | 2,528,578 | 3.2 | 2.4 | 4 | 57.6 |
| 90-94 | 2,137,536 | 626,747 | 1,510,789 | 1.7 | 1.1 | 2.4 | 41.5 |
| 95-99 | 712,019 | 151,909 | 560,110 | 0.6 | 0.3 | 0.9 | 27.1 |
| 100+ | 115,971 | 15,258 | 100,713 | 0.1 | 0 | 0.2 | 15.1 |


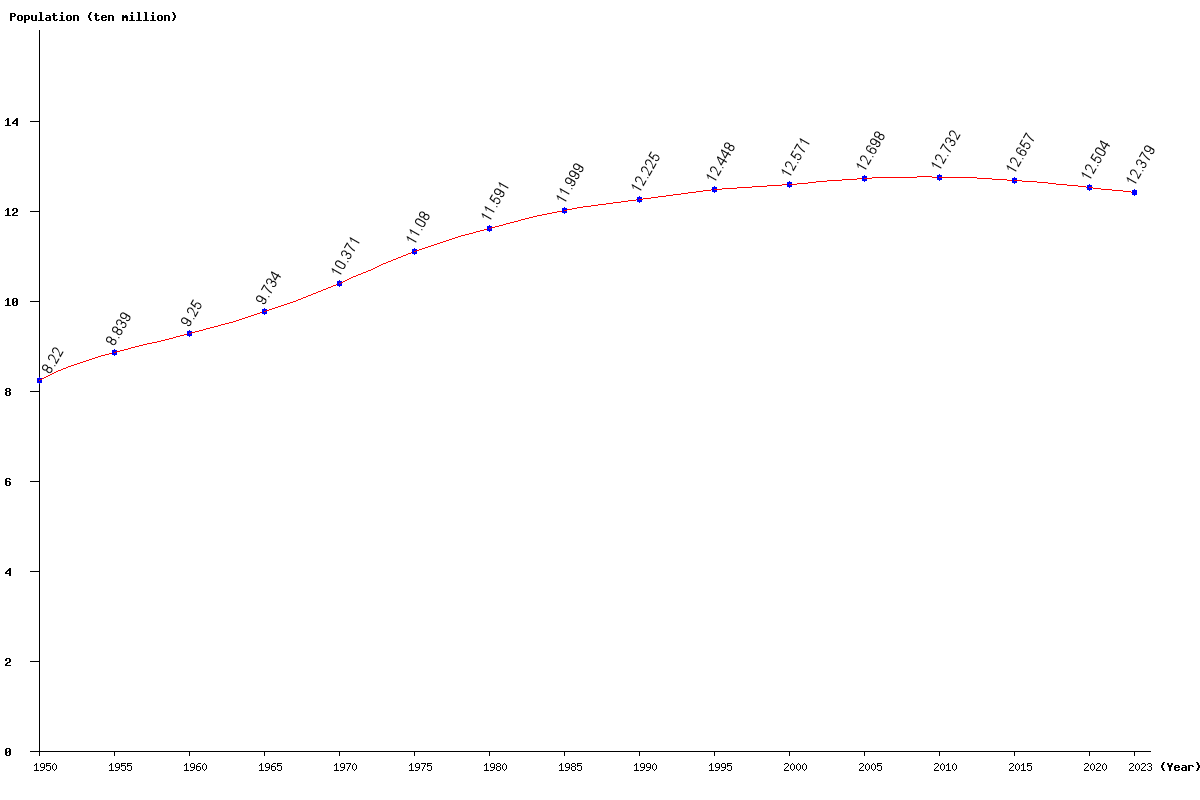
| Year | Population | Yearly % Change |
Yearly Change |
Sex ratio | Density (P/Km²) |
|---|---|---|---|---|---|
| 2024 | 123,325,631 | -0.38 | -464,230 | 94.19 | 338.29 |
| 2023 | 123,789,861 | -0.36 | -441,181 | 94.24 | 339.56 |
| 2022 | 124,231,042 | -0.33 | -416,804 | 94.29 | 340.77 |
| 2021 | 124,647,846 | -0.31 | -391,178 | 94.34 | 341.92 |
| 2020 | 125,039,024 | -0.29 | -363,887 | 94.40 | 342.99 |
| 2019 | 125,402,911 | -0.27 | -335,446 | 94.45 | 343.99 |
| 2018 | 125,738,357 | -0.24 | -306,854 | 94.51 | 344.91 |
| 2017 | 126,045,211 | -0.22 | -278,504 | 94.57 | 345.75 |
| 2016 | 126,323,715 | -0.20 | -249,766 | 94.63 | 346.51 |
| 2015 | 126,573,481 | -0.17 | -221,083 | 94.68 | 347.20 |
| 2014 | 126,794,564 | -0.15 | -190,400 | 94.74 | 347.81 |
| 2013 | 126,984,964 | -0.12 | -154,857 | 94.80 | 348.33 |
| 2012 | 127,139,821 | -0.09 | -113,079 | 94.86 | 348.75 |
| 2011 | 127,252,900 | -0.05 | -66,902 | 94.91 | 349.06 |
| 2010 | 127,319,802 | -0.02 | -21,082 | 94.97 | 349.25 |
| 2005 | 126,978,754 | 1.01 | 1,264,080 | 95.28 | 348.31 |
| 2000 | 125,714,674 | 0.99 | 1,231,369 | 95.74 | 344.84 |
| 1995 | 124,483,305 | 1.83 | 2,234,020 | 96.12 | 341.47 |
| 1990 | 122,249,285 | 1.88 | 2,260,622 | 96.21 | 335.34 |
| 1985 | 119,988,663 | 3.52 | 4,076,559 | 96.56 | 329.14 |
| 1980 | 115,912,104 | 4.61 | 5,107,585 | 96.69 | 317.96 |
| 1975 | 110,804,519 | 6.84 | 7,096,982 | 96.74 | 303.94 |
| 1970 | 103,707,537 | 6.54 | 6,365,685 | 96.21 | 284.48 |
| 1965 | 97,341,852 | 5.23 | 4,841,098 | 96.26 | 267.02 |
| 1960 | 92,500,754 | 4.65 | 4,110,760 | 96.31 | 253.74 |
| 1955 | 88,389,994 | 7.53 | 6,190,524 | 96.37 | 242.46 |
| 1950 | 82,199,470 | 96.03 | 225.48 |
