Guadeloupe population
0
Births this year: 0
Births today 0
Deaths this year 0
Deaths today 0
0
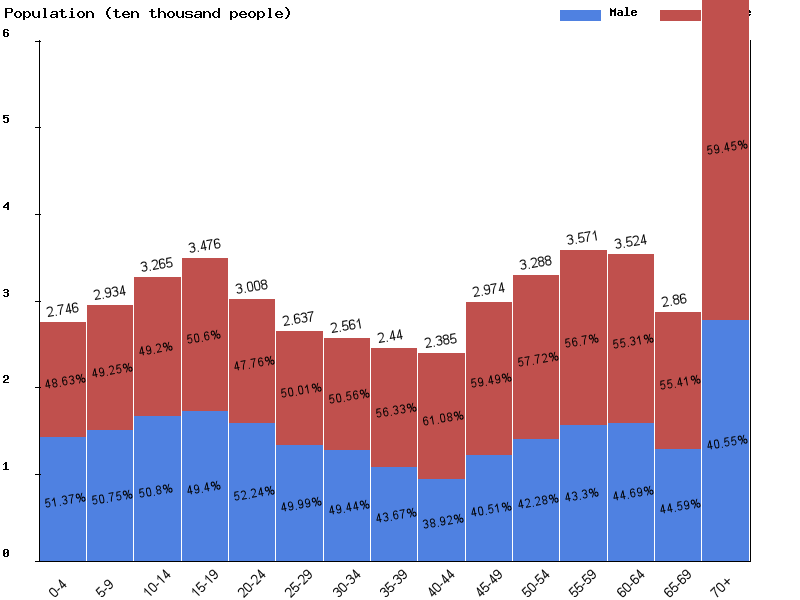
| Age | Both Sexes Population | Male Population | Female Population | Both Sexes (%) | Male (%) | Female (%) | Sex ratio (female/male) |
|---|---|---|---|---|---|---|---|
| Total | 484,765 | 221,770 | 262,995 | 100 | 100 | 100 | 84.3 |
| 00-04 | 27,458 | 14,106 | 13,352 | 5.7 | 6.4 | 5.1 | 105.6 |
| 05-09 | 29,342 | 14,892 | 14,450 | 6.1 | 6.7 | 5.5 | 103.1 |
| 10-14 | 32,649 | 16,585 | 16,064 | 6.7 | 7.5 | 6.1 | 103.2 |
| 15-19 | 34,761 | 17,172 | 17,589 | 7.2 | 7.7 | 6.7 | 97.6 |
| 20-24 | 30,080 | 15,715 | 14,365 | 6.2 | 7.1 | 5.5 | 109.4 |
| 25-29 | 26,373 | 13,184 | 13,189 | 5.4 | 5.9 | 5 | 100 |
| 30-34 | 25,605 | 12,659 | 12,946 | 5.3 | 5.7 | 4.9 | 97.8 |
| 35-39 | 24,395 | 10,654 | 13,741 | 5 | 4.8 | 5.2 | 77.5 |
| 40-44 | 23,850 | 9,282 | 14,568 | 4.9 | 4.2 | 5.5 | 63.7 |
| 45-49 | 29,744 | 12,049 | 17,695 | 6.1 | 5.4 | 6.7 | 68.1 |
| 50-54 | 32,879 | 13,902 | 18,977 | 6.8 | 6.3 | 7.2 | 73.3 |
| 55-59 | 35,713 | 15,464 | 20,249 | 7.4 | 7 | 7.7 | 76.4 |
| 60-64 | 35,241 | 15,749 | 19,492 | 7.3 | 7.1 | 7.4 | 80.8 |
| 65-69 | 28,603 | 12,754 | 15,849 | 5.9 | 5.8 | 6 | 80.5 |
| 70-74 | 23,944 | 10,376 | 13,568 | 4.9 | 4.7 | 5.2 | 76.5 |
| 75-79 | 18,046 | 7,652 | 10,394 | 3.7 | 3.5 | 4 | 73.6 |
| 80-84 | 12,315 | 4,942 | 7,373 | 2.5 | 2.2 | 2.8 | 67 |
| 85-89 | 7,693 | 2,764 | 4,929 | 1.6 | 1.2 | 1.9 | 56.1 |
| 90-94 | 4,128 | 1,333 | 2,795 | 0.9 | 0.6 | 1.1 | 47.7 |
| 95-99 | 1,516 | 430 | 1,086 | 0.3 | 0.2 | 0.4 | 39.6 |
| 100+ | 430 | 106 | 324 | 0.1 | 0 | 0.1 | 32.7 |


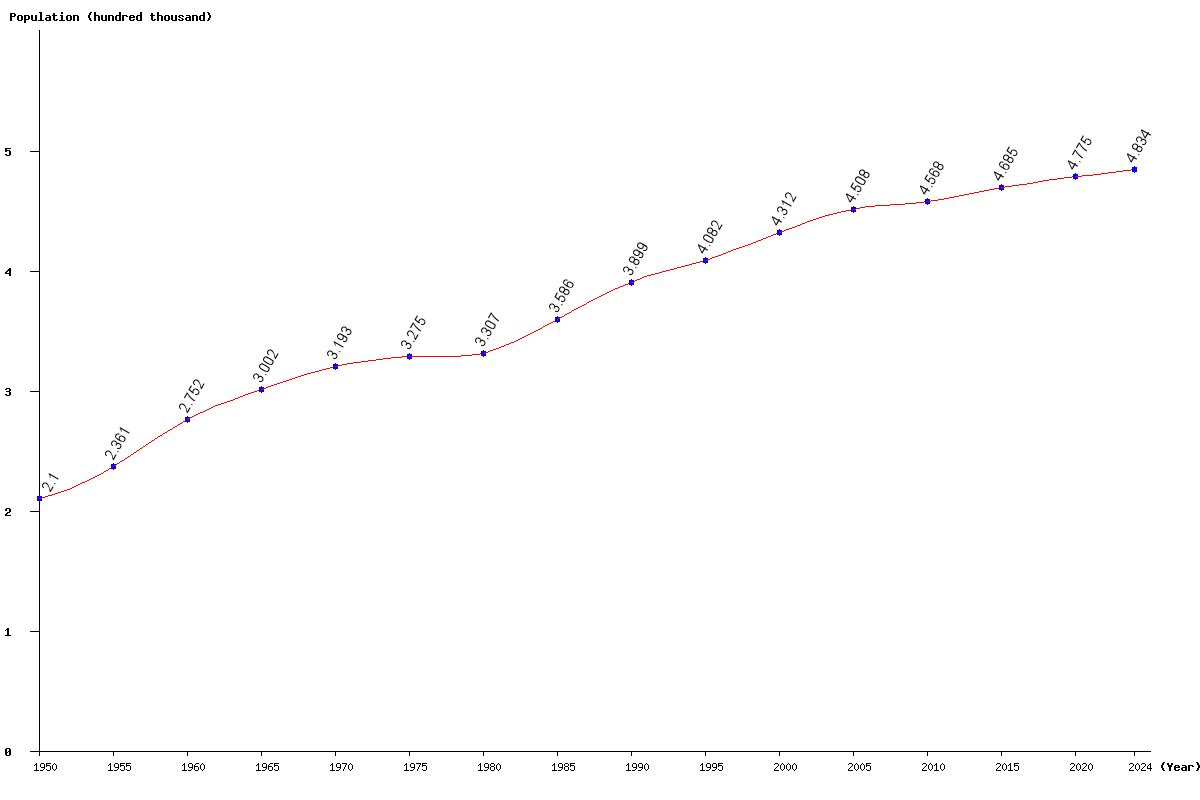
| Year | Population | Yearly % Change |
Yearly Change |
Sex ratio | Density (P/Km²) |
|---|---|---|---|---|---|
| 2024 | 483,409 | 0.29 | 1,394 | 84.43 | 286.04 |
| 2023 | 482,015 | 0.30 | 1,440 | 84.55 | 285.22 |
| 2022 | 480,575 | 0.31 | 1,498 | 84.68 | 284.36 |
| 2021 | 479,077 | 0.33 | 1,568 | 84.82 | 283.48 |
| 2020 | 477,509 | 0.34 | 1,618 | 84.98 | 282.55 |
| 2019 | 475,891 | 0.35 | 1,668 | 85.16 | 281.59 |
| 2018 | 474,223 | 0.37 | 1,761 | 85.35 | 280.61 |
| 2017 | 472,462 | 0.41 | 1,915 | 85.56 | 279.56 |
| 2016 | 470,547 | 0.45 | 2,097 | 85.79 | 278.43 |
| 2015 | 468,450 | 0.50 | 2,350 | 86.04 | 277.19 |
| 2014 | 466,100 | 0.55 | 2,564 | 86.32 | 275.80 |
| 2013 | 463,536 | 0.56 | 2,571 | 86.62 | 274.28 |
| 2012 | 460,965 | 0.50 | 2,298 | 86.95 | 272.76 |
| 2011 | 458,667 | 0.40 | 1,845 | 87.31 | 271.40 |
| 2010 | 456,822 | 0.28 | 1,286 | 87.70 | 270.31 |
| 2005 | 450,761 | 4.55 | 19,604 | 89.98 | 266.72 |
| 2000 | 431,157 | 5.64 | 23,005 | 92.14 | 255.12 |
| 1995 | 408,152 | 4.68 | 18,245 | 93.90 | 241.51 |
| 1990 | 389,907 | 8.72 | 31,274 | 95.47 | 230.71 |
| 1985 | 358,633 | 8.44 | 27,904 | 95.75 | 212.21 |
| 1980 | 330,729 | 0.98 | 3,204 | 96.01 | 195.70 |
| 1975 | 327,525 | 2.57 | 8,196 | 95.67 | 193.80 |
| 1970 | 319,329 | 6.38 | 19,159 | 96.20 | 188.95 |
| 1965 | 300,170 | 9.09 | 25,001 | 96.17 | 177.62 |
| 1960 | 275,169 | 16.57 | 39,108 | 96.56 | 162.82 |
| 1955 | 236,061 | 12.41 | 26,062 | 94.96 | 139.68 |
| 1950 | 209,999 | 92.66 | 124.26 |
