Gibraltar population
30,788
Births this year: 3,612
Births today 0
Deaths this year 2,152
Deaths today 0
30,788
| Region Name | Percents | Number |
|---|---|---|
| Roman Catholic | 78.1% | 22,905 people |
| Church of England | 7% | 2,053 people |
| other Christian | 3.2% | 938 people |
| Muslim | 4% | 1,173 people |
| Jewish | 2.1% | 616 people |
| Hindu | 1.8% | 528 people |
| other or unspecified | 0.9% | 264 people |
| none | 2.9% | 851 people |
| Ethnic groups Name | Percents | Number |
|---|---|---|
| Spanish, Italian, English, Maltese, Portuguese, German, North Africans | 100% | 29,328 people |
| Year | Population | Yearly % Change |
Yearly Change |
Sex ratio | Density (P/Km²) |
|---|---|---|---|---|---|
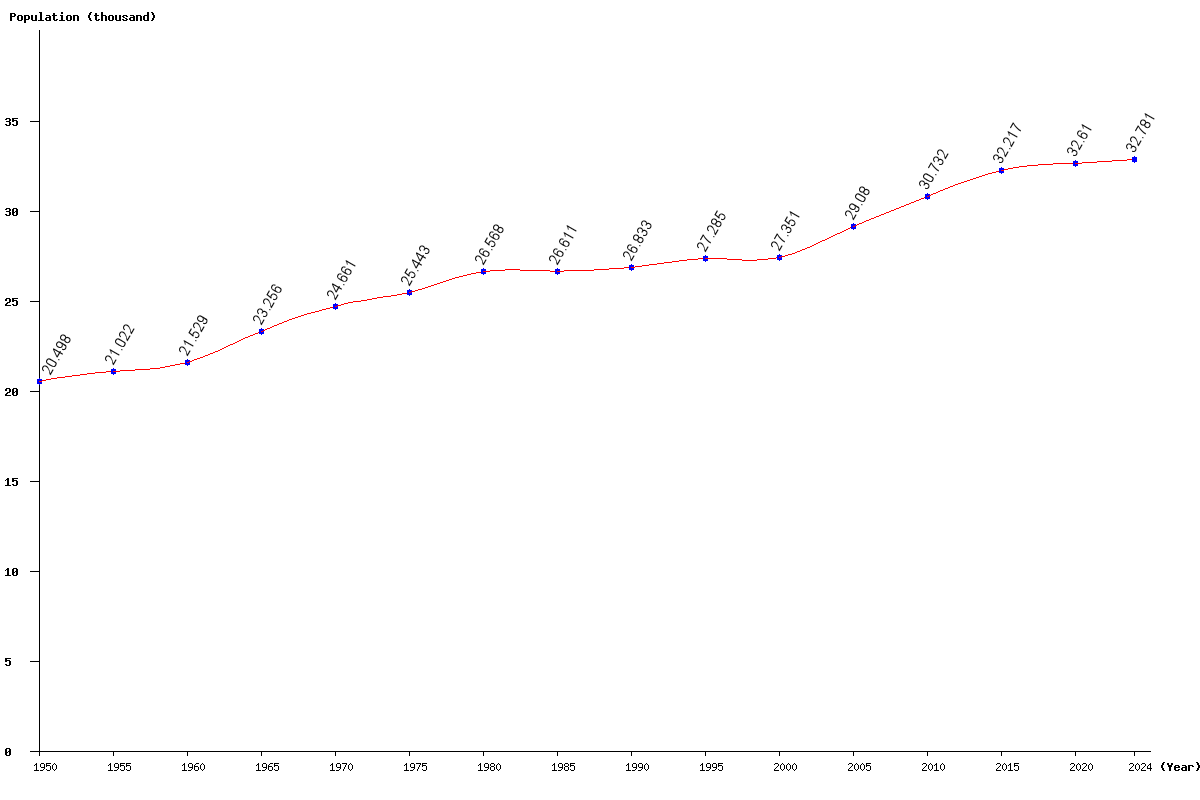
| 2024 | 32,781 | 0.11 | 36 | 98.33 | 3,278.10 |
| 2023 | 32,745 | 0.13 | 44 | 98.33 | 3,274.50 |
| 2022 | 32,701 | 0.14 | 46 | 98.33 | 3,270.10 |
| 2021 | 32,655 | 0.14 | 45 | 98.33 | 3,265.50 |
| 2020 | 32,610 | 0.12 | 39 | 98.33 | 3,261.00 |
| 2019 | 32,571 | 0.13 | 41 | 98.34 | 3,257.10 |
| 2018 | 32,530 | 0.18 | 58 | 98.34 | 3,253.00 |
| 2017 | 32,472 | 0.31 | 99 | 98.34 | 3,247.20 |
| 2016 | 32,373 | 0.48 | 156 | 98.32 | 3,237.30 |
| 2015 | 32,217 | 0.69 | 220 | 98.28 | 3,221.70 |
| 2014 | 31,997 | 0.87 | 277 | 98.22 | 3,199.70 |
| 2013 | 31,720 | 1.01 | 318 | 98.14 | 3,172.00 |
| 2012 | 31,402 | 1.08 | 335 | 98.05 | 3,140.20 |
| 2011 | 31,067 | 1.09 | 335 | 97.97 | 3,106.70 |
| 2010 | 30,732 | 1.07 | 325 | 97.90 | 3,073.20 |
| 2005 | 29,080 | 6.32 | 1,729 | 97.74 | 2,908.00 |
| 2000 | 27,351 | 0.24 | 66 | 97.36 | 2,735.10 |
| 1995 | 27,285 | 1.68 | 452 | 96.78 | 2,728.50 |
| 1990 | 26,833 | 0.83 | 222 | 96.21 | 2,683.30 |
| 1985 | 26,611 | 0.16 | 43 | 96.14 | 2,661.10 |
| 1980 | 26,568 | 4.42 | 1,125 | 96.10 | 2,656.80 |
| 1975 | 25,443 | 3.17 | 782 | 96.69 | 2,544.30 |
| 1970 | 24,661 | 6.04 | 1,405 | 96.99 | 2,466.10 |
| 1965 | 23,256 | 8.02 | 1,727 | 97.81 | 2,325.60 |
| 1960 | 21,529 | 2.41 | 507 | 98.36 | 2,152.90 |
| 1955 | 21,022 | 2.56 | 524 | 98.91 | 2,102.20 |
| 1950 | 20,498 | 99.81 | 2,049.80 |