Estonia population
1,234,086
Births this year: 114,510
Births today 10
Deaths this year 138,969
Deaths today 12
1,234,086
| Region Name | Percents | Number |
|---|---|---|
| Lutheran | 9.9% | 124,596 people |
| Orthodox | 16.2% | 203,884 people |
| other Christian (including Methodist, Seventh-Day Adventist, Roman Catholic, Pentecostal) | 2.2% | 27,688 people |
| other | 0.9% | 11,327 people |
| none | 54.1% | 680,873 people |
| unspecified | 16.7% | 210,177 people |
| Ethnic groups Name | Percents | Number |
|---|---|---|
| Estonian | 68.7% | 864,620 people |
| Russian | 24.8% | 312,119 people |
| Ukrainian | 1.7% | 21,395 people |
| Belarusian | 1% | 12,585 people |
| Finn | 0.6% | 7,551 people |
| other | 1.6% | 20,137 people |
| unspecified | 1.6% | 20,137 people |
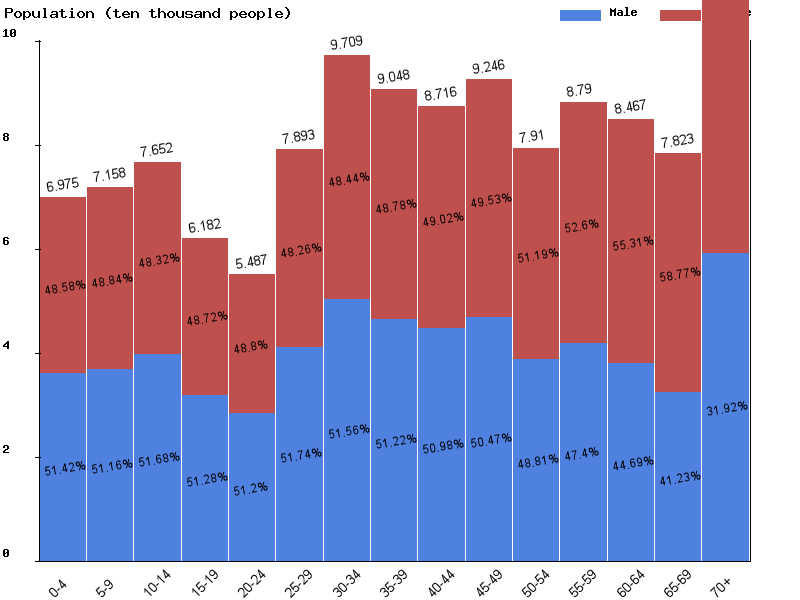
| Age | Both Sexes Population | Male Population | Female Population | Both Sexes (%) | Male (%) | Female (%) | Sex ratio (female/male) |
|---|---|---|---|---|---|---|---|
| Total | 1,272,241 | 602,257 | 669,984 | 100 | 100 | 100 | 89.9 |
| 00-04 | 65,243 | 33,550 | 31,693 | 5.1 | 5.6 | 4.7 | 105.9 |
| 05-09 | 69,378 | 35,673 | 33,705 | 5.5 | 5.9 | 5 | 105.8 |
| 10-14 | 71,193 | 36,426 | 34,767 | 5.6 | 6 | 5.2 | 104.8 |
| 15-19 | 76,048 | 39,284 | 36,764 | 6 | 6.5 | 5.5 | 106.9 |
| 20-24 | 61,227 | 31,351 | 29,876 | 4.8 | 5.2 | 4.5 | 104.9 |
| 25-29 | 54,101 | 27,656 | 26,445 | 4.3 | 4.6 | 3.9 | 104.6 |
| 30-34 | 77,893 | 40,208 | 37,685 | 6.1 | 6.7 | 5.6 | 106.7 |
| 35-39 | 95,870 | 49,304 | 46,566 | 7.5 | 8.2 | 7 | 105.9 |
| 40-44 | 89,189 | 45,548 | 43,641 | 7 | 7.6 | 6.5 | 104.4 |
| 45-49 | 85,517 | 43,371 | 42,146 | 6.7 | 7.2 | 6.3 | 102.9 |
| 50-54 | 90,142 | 45,097 | 45,045 | 7.1 | 7.5 | 6.7 | 100.1 |
| 55-59 | 76,289 | 36,678 | 39,611 | 6 | 6.1 | 5.9 | 92.6 |
| 60-64 | 83,365 | 38,518 | 44,847 | 6.6 | 6.4 | 6.7 | 85.9 |
| 65-69 | 78,518 | 33,712 | 44,806 | 6.2 | 5.6 | 6.7 | 75.2 |
| 70-74 | 70,368 | 27,382 | 42,986 | 5.5 | 4.5 | 6.4 | 63.7 |
| 75-79 | 49,642 | 17,475 | 32,167 | 3.9 | 2.9 | 4.8 | 54.3 |
| 80-84 | 37,979 | 11,551 | 26,428 | 3 | 1.9 | 3.9 | 43.7 |
| 85-89 | 26,108 | 6,573 | 19,535 | 2.1 | 1.1 | 2.9 | 33.6 |
| 90-94 | 11,140 | 2,430 | 8,710 | 0.9 | 0.4 | 1.3 | 27.9 |
| 95-99 | 2,770 | 444 | 2,326 | 0.2 | 0.1 | 0.3 | 19.1 |
| 100+ | 261 | 26 | 235 | 0 | 0 | 0 | 11.1 |

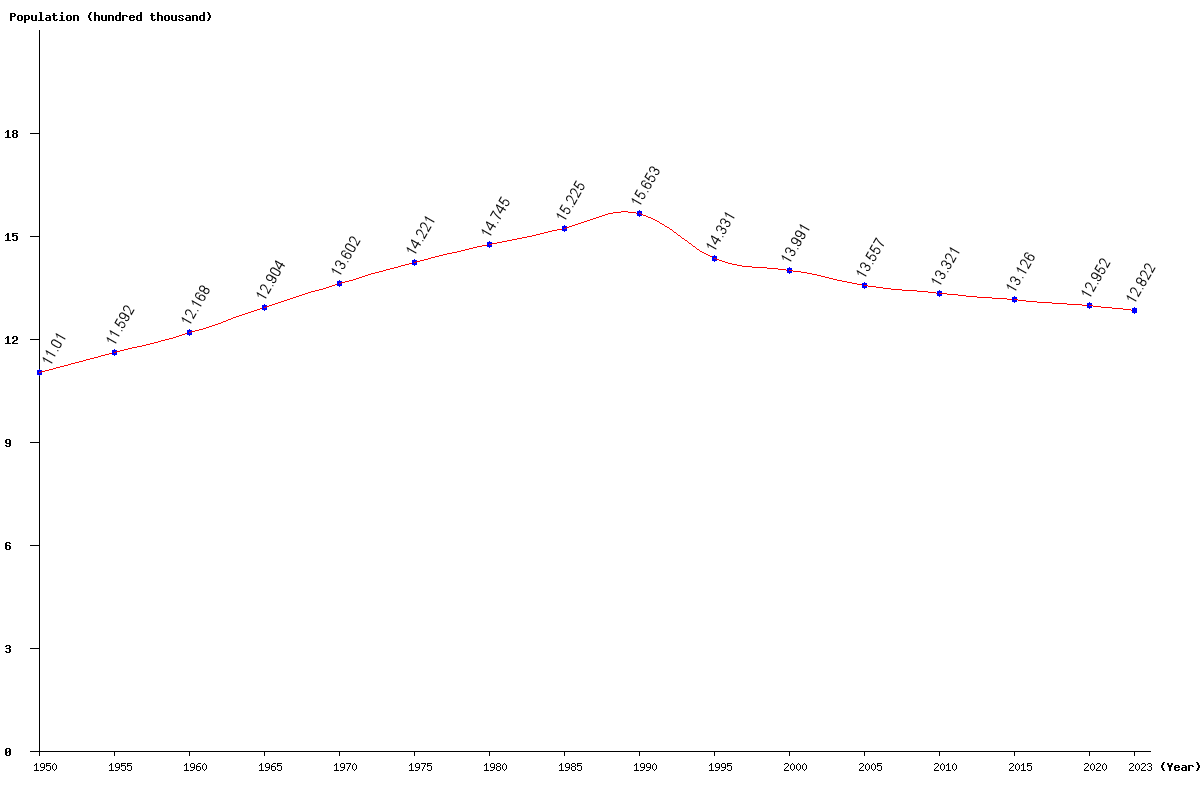
| Year | Population | Yearly % Change |
Yearly Change |
Sex ratio | Density (P/Km²) |
|---|---|---|---|---|---|
| 2024 | 1,277,356 | -0.38 | -4,863 | 89.69 | 30.13 |
| 2023 | 1,282,219 | -0.36 | -4,595 | 89.48 | 30.25 |
| 2022 | 1,286,814 | -0.33 | -4,313 | 89.27 | 30.36 |
| 2021 | 1,291,127 | -0.31 | -4,032 | 89.07 | 30.46 |
| 2020 | 1,295,159 | -0.29 | -3,745 | 88.87 | 30.55 |
| 2019 | 1,298,904 | -0.27 | -3,497 | 88.69 | 30.64 |
| 2018 | 1,302,401 | -0.26 | -3,354 | 88.51 | 30.72 |
| 2017 | 1,305,755 | -0.26 | -3,349 | 88.33 | 30.80 |
| 2016 | 1,309,104 | -0.26 | -3,454 | 88.16 | 30.88 |
| 2015 | 1,312,558 | -0.28 | -3,645 | 87.98 | 30.96 |
| 2014 | 1,316,203 | -0.29 | -3,847 | 87.80 | 31.05 |
| 2013 | 1,320,050 | -0.30 | -3,990 | 87.63 | 31.14 |
| 2012 | 1,324,040 | -0.30 | -4,028 | 87.46 | 31.23 |
| 2011 | 1,328,068 | -0.30 | -4,021 | 87.30 | 31.33 |
| 2010 | 1,332,089 | -0.29 | -3,924 | 87.16 | 31.42 |
| 2005 | 1,355,662 | -3.11 | -43,483 | 86.81 | 31.98 |
| 2000 | 1,399,145 | -2.37 | -33,931 | 87.41 | 33.01 |
| 1995 | 1,433,076 | -8.45 | -132,244 | 86.15 | 33.81 |
| 1990 | 1,565,320 | 2.81 | 42,843 | 87.84 | 36.93 |
| 1985 | 1,522,477 | 3.25 | 47,990 | 86.93 | 35.92 |
| 1980 | 1,474,487 | 3.69 | 52,417 | 86.19 | 34.78 |
| 1975 | 1,422,070 | 4.55 | 61,834 | 85.39 | 33.55 |
| 1970 | 1,360,236 | 5.41 | 69,799 | 84.32 | 32.09 |
| 1965 | 1,290,437 | 6.05 | 73,606 | 81.96 | 30.44 |
| 1960 | 1,216,831 | 4.97 | 57,593 | 79.04 | 28.71 |
| 1955 | 1,159,238 | 5.29 | 58,240 | 76.93 | 27.35 |
| 1950 | 1,100,998 | 74.35 | 25.97 |