Egypt population
94,666,993
Births this year: 0
Births today 0
Deaths this year 0
Deaths today 0
94,666,993
| Region Name | Percents | Number |
|---|---|---|
| Muslim (predominantly Sunni) | 90% | 85,200,294 people |
| Christian (majority Coptic Orthodox, other Christians include Armenian Apostolic, Catholic, Maronite, Orthodox, and Anglican) | 10% | 9,466,699 people |
| Ethnic groups Name | Percents | Number |
|---|---|---|
| Egyptian | 99.6% | 94,288,325 people |
| other | 0.4% | 378,668 people |
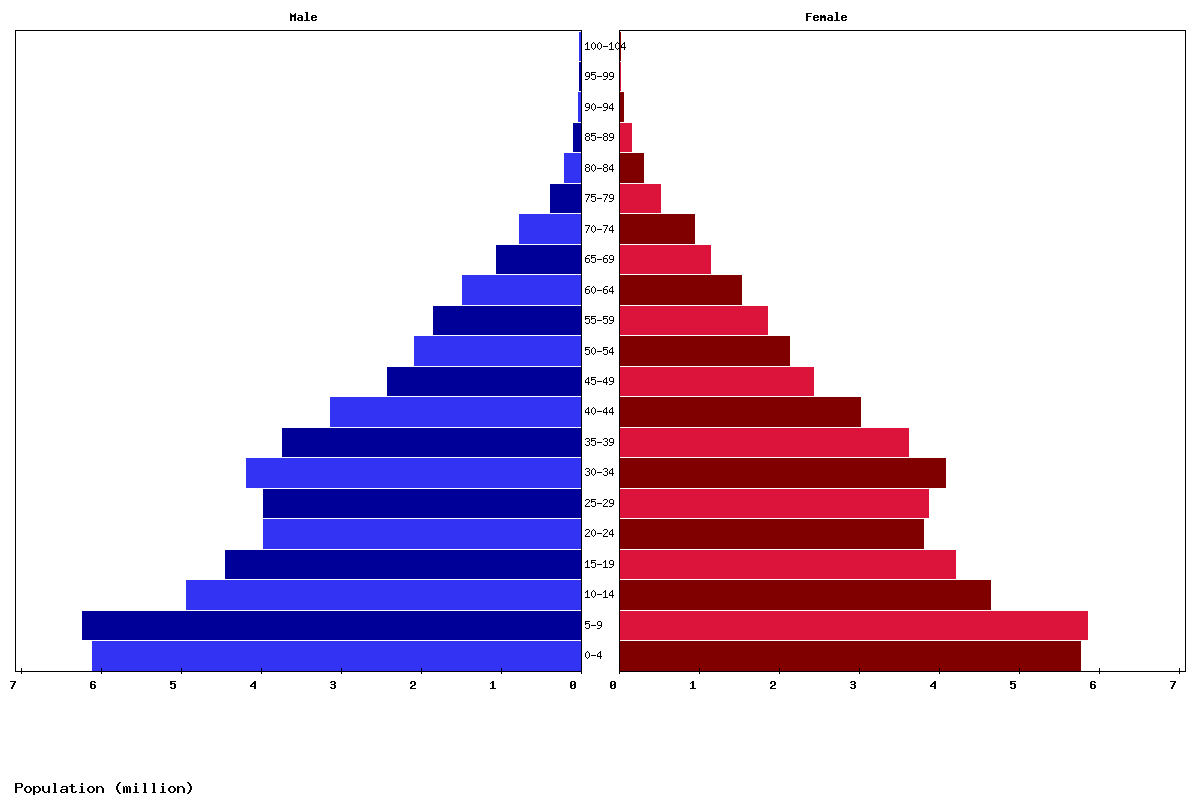
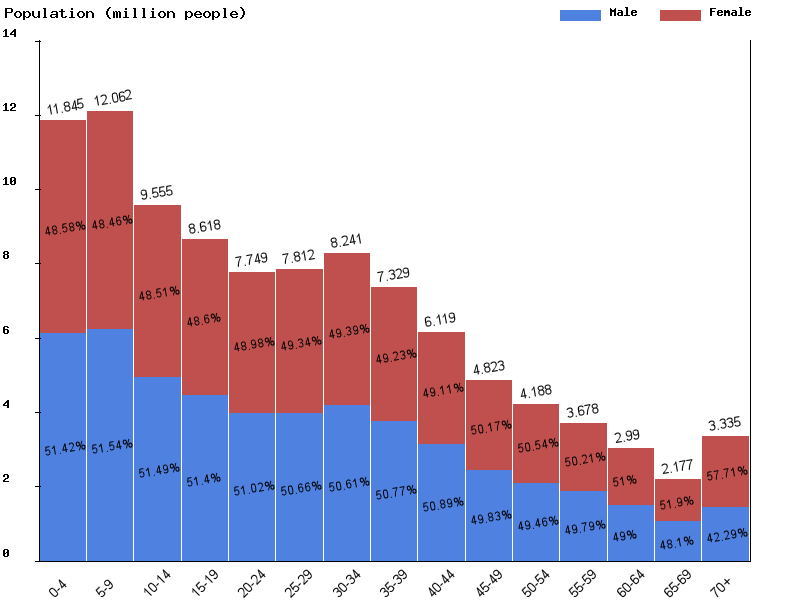
| Age | Both Sexes Population | Male Population | Female Population | Both Sexes (%) | Male (%) | Female (%) | Sex ratio (female/male) |
|---|---|---|---|---|---|---|---|
| Total | 108,939,338 | 55,032,926 | 53,906,412 | 100 | 100 | 100 | 102.1 |
| 00-04 | 11,476,510 | 5,901,615 | 5,574,895 | 10.5 | 10.7 | 10.3 | 105.9 |
| 05-09 | 11,797,343 | 6,064,465 | 5,732,878 | 10.8 | 11 | 10.6 | 105.8 |
| 10-14 | 12,034,827 | 6,199,927 | 5,834,900 | 11 | 11.3 | 10.8 | 106.3 |
| 15-19 | 9,523,021 | 4,896,612 | 4,626,409 | 8.7 | 8.9 | 8.6 | 105.8 |
| 20-24 | 8,503,310 | 4,353,092 | 4,150,218 | 7.8 | 7.9 | 7.7 | 104.9 |
| 25-29 | 7,581,889 | 3,842,992 | 3,738,897 | 7 | 7 | 6.9 | 102.8 |
| 30-34 | 7,711,551 | 3,897,825 | 3,813,726 | 7.1 | 7.1 | 7.1 | 102.2 |
| 35-39 | 8,210,857 | 4,161,313 | 4,049,544 | 7.5 | 7.6 | 7.5 | 102.8 |
| 40-44 | 7,316,494 | 3,716,207 | 3,600,287 | 6.7 | 6.8 | 6.7 | 103.2 |
| 45-49 | 6,074,199 | 3,087,897 | 2,986,302 | 5.6 | 5.6 | 5.5 | 103.4 |
| 50-54 | 4,700,981 | 2,326,658 | 2,374,323 | 4.3 | 4.2 | 4.4 | 98 |
| 55-59 | 3,992,678 | 1,946,505 | 2,046,173 | 3.7 | 3.5 | 3.8 | 95.1 |
| 60-64 | 3,423,849 | 1,673,398 | 1,750,451 | 3.1 | 3 | 3.2 | 95.6 |
| 65-69 | 2,668,589 | 1,273,230 | 1,395,359 | 2.4 | 2.3 | 2.6 | 91.2 |
| 70-74 | 1,814,206 | 840,783 | 973,423 | 1.7 | 1.5 | 1.8 | 86.4 |
| 75-79 | 1,248,004 | 533,049 | 714,955 | 1.1 | 1 | 1.3 | 74.6 |
| 80-84 | 541,162 | 210,143 | 331,019 | 0.5 | 0.4 | 0.6 | 63.5 |
| 85-89 | 233,581 | 82,696 | 150,885 | 0.2 | 0.2 | 0.3 | 54.8 |
| 90-94 | 71,711 | 21,121 | 50,590 | 0.1 | 0 | 0.1 | 41.7 |
| 95-99 | 13,172 | 3,125 | 10,047 | 0 | 0 | 0 | 31.1 |
| 100+ | 1,404 | 273 | 1,131 | 0 | 0 | 0 | 24.1 |


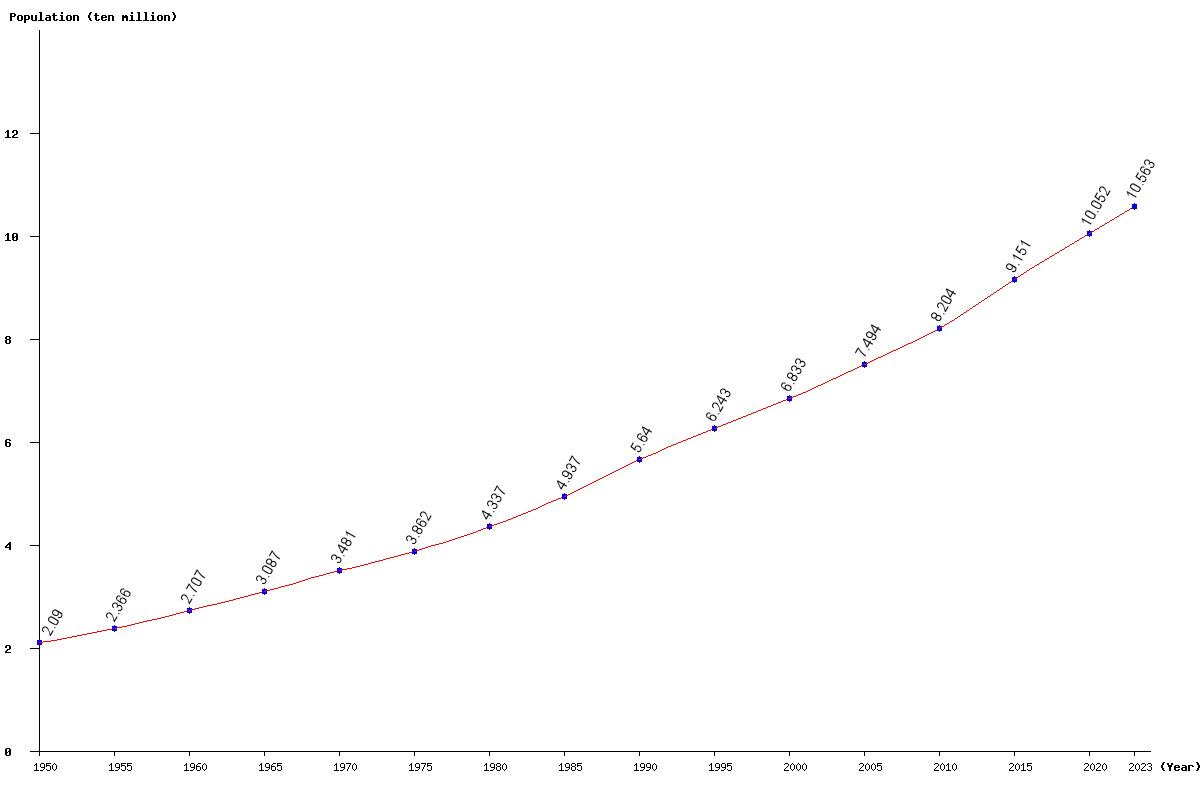
| Year | Population | Yearly % Change |
Yearly Change |
Sex ratio | Density (P/Km²) |
|---|---|---|---|---|---|
| 2024 | 107,290,499 | 1.57 | 1,662,779 | 102.11 | 107.78 |
| 2023 | 105,627,720 | 1.62 | 1,680,643 | 102.13 | 106.11 |
| 2022 | 103,947,077 | 1.67 | 1,702,377 | 102.15 | 104.42 |
| 2021 | 102,244,700 | 1.72 | 1,726,896 | 102.16 | 102.71 |
| 2020 | 100,517,804 | 1.77 | 1,746,417 | 102.17 | 100.98 |
| 2019 | 98,771,387 | 1.82 | 1,764,467 | 102.18 | 99.22 |
| 2018 | 97,006,920 | 1.88 | 1,791,818 | 102.18 | 97.45 |
| 2017 | 95,215,102 | 1.96 | 1,831,528 | 102.18 | 95.65 |
| 2016 | 93,383,574 | 2.05 | 1,875,490 | 102.17 | 93.81 |
| 2015 | 91,508,084 | 2.15 | 1,928,414 | 102.15 | 91.93 |
| 2014 | 89,579,670 | 2.24 | 1,965,761 | 102.12 | 89.99 |
| 2013 | 87,613,909 | 2.28 | 1,953,007 | 102.07 | 88.01 |
| 2012 | 85,660,902 | 2.24 | 1,873,268 | 102.02 | 86.05 |
| 2011 | 83,787,634 | 2.13 | 1,746,640 | 101.96 | 84.17 |
| 2010 | 82,040,994 | 1.99 | 1,598,551 | 101.89 | 82.42 |
| 2005 | 74,942,115 | 9.67 | 6,607,210 | 101.57 | 75.28 |
| 2000 | 68,334,905 | 9.45 | 5,900,378 | 101.10 | 68.65 |
| 1995 | 62,434,527 | 10.70 | 6,037,254 | 101.15 | 62.72 |
| 1990 | 56,397,273 | 14.23 | 7,023,467 | 100.69 | 56.66 |
| 1985 | 49,373,806 | 13.84 | 6,004,254 | 100.83 | 49.60 |
| 1980 | 43,369,552 | 12.29 | 4,745,142 | 101.78 | 43.57 |
| 1975 | 38,624,410 | 10.96 | 3,815,811 | 102.14 | 38.80 |
| 1970 | 34,808,599 | 12.75 | 3,935,617 | 102.52 | 34.97 |
| 1965 | 30,872,982 | 14.04 | 3,800,585 | 102.79 | 31.01 |
| 1960 | 27,072,397 | 14.44 | 3,416,181 | 102.61 | 27.20 |
| 1955 | 23,656,216 | 13.20 | 2,758,979 | 102.31 | 23.76 |
| 1950 | 20,897,237 | 101.70 | 20.99 |
