Cook Islands population
10,096
Births this year: 1,313
Births today 0
Deaths this year 773
Deaths today 0
10,096
| Region Name | Percents | Number |
|---|---|---|
| Protestant (Cook Islands Christian Church, Seventh-Day Adventist, Assemblies of God, Apostolic Church) | 62.8% | 6,001 people |
| Roman Catholic | 17% | 1,625 people |
| Mormon | 4.4% | 420 people |
| other | 8% | 764 people |
| none | 5.6% | 535 people |
| no response | 2.2% | 210 people |
| Ethnic groups Name | Percents | Number |
|---|---|---|
| Cook Island Maori (Polynesian) | 81.3% | 7,769 people |
| part Cook Island Maori | 6.7% | 640 people |
| other | 11.9% | 1,137 people |
| Year | Population | Yearly % Change |
Yearly Change |
Sex ratio | Density (P/Km²) |
|---|---|---|---|---|---|
| 2025 | 22,043 | 0.52 | 113 | 99.83 | 91.85 |
| 2024 | 21,930 | 0.54 | 117 | 99.80 | 91.38 |
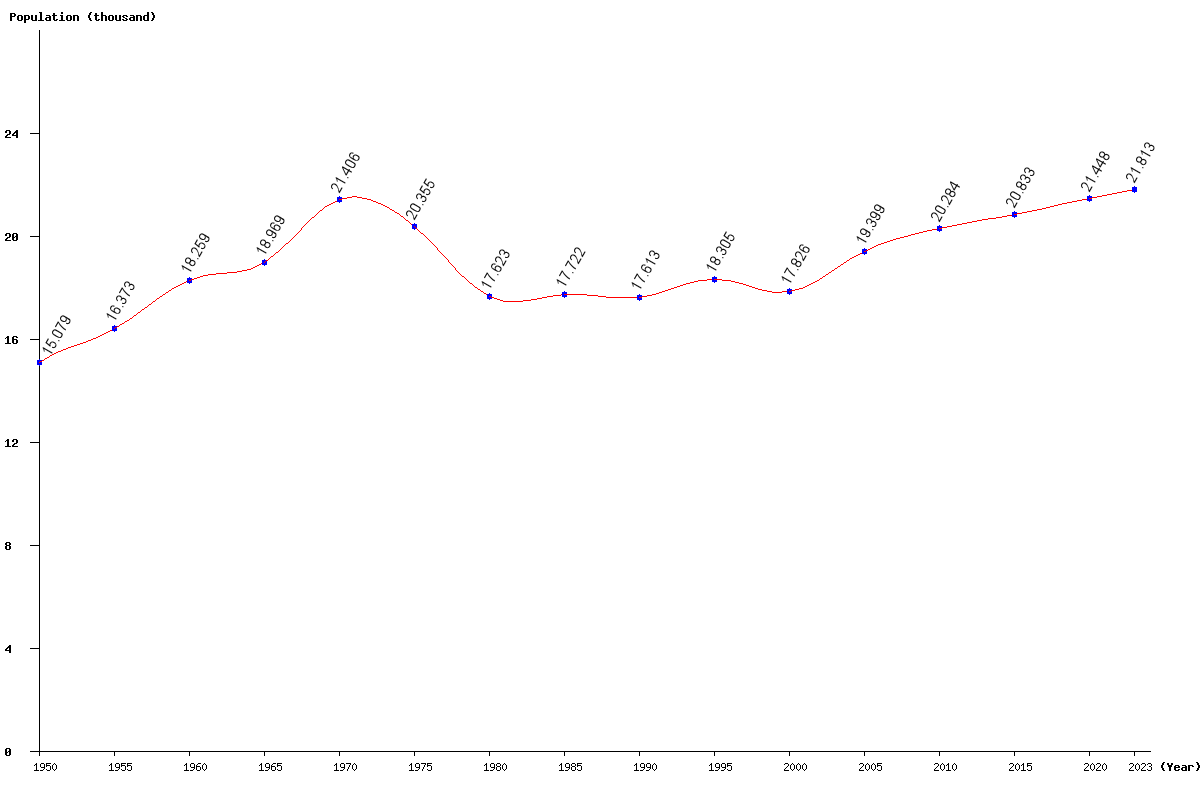
| 2023 | 21,813 | 0.55 | 120 | 99.78 | 90.89 |
| 2022 | 21,693 | 0.57 | 122 | 99.75 | 90.39 |
| 2021 | 21,571 | 0.57 | 123 | 99.72 | 89.88 |
| 2020 | 21,448 | 0.59 | 125 | 99.69 | 89.37 |
| 2019 | 21,323 | 0.60 | 127 | 99.66 | 88.85 |
| 2018 | 21,196 | 0.60 | 127 | 99.62 | 88.32 |
| 2017 | 21,069 | 0.58 | 121 | 99.58 | 87.79 |
| 2016 | 20,948 | 0.55 | 115 | 99.53 | 87.28 |
| 2015 | 20,833 | 0.52 | 108 | 99.48 | 86.80 |
| 2014 | 20,725 | 0.50 | 104 | 99.43 | 86.35 |
| 2013 | 20,621 | 0.50 | 103 | 99.37 | 85.92 |
| 2012 | 20,518 | 0.54 | 111 | 99.31 | 85.49 |
| 2011 | 20,407 | 0.61 | 123 | 99.24 | 85.03 |
| 2010 | 20,284 | 0.65 | 130 | 99.18 | 84.52 |
| 2005 | 19,399 | 8.82 | 1,573 | 98.82 | 80.83 |
| 2000 | 17,826 | -2.62 | -479 | 98.43 | 74.28 |
| 1995 | 18,305 | 3.93 | 692 | 98.01 | 76.27 |
| 1990 | 17,613 | -0.62 | -109 | 97.45 | 73.39 |
| 1985 | 17,722 | 0.56 | 99 | 96.78 | 73.84 |
| 1980 | 17,623 | -13.42 | -2,732 | 96.00 | 73.43 |
| 1975 | 20,355 | -4.91 | -1,051 | 95.10 | 84.81 |
| 1970 | 21,406 | 12.85 | 2,437 | 94.05 | 89.19 |
| 1965 | 18,969 | 3.89 | 710 | 92.84 | 79.04 |
| 1960 | 18,259 | 11.52 | 1,886 | 91.45 | 76.08 |
| 1955 | 16,373 | 8.58 | 1,294 | 89.87 | 68.22 |
| 1950 | 15,079 | 88.12 | 62.83 |