Caribbean population
0
Births this year: 0
Births today 0
Deaths this year 0
Deaths today 0
0
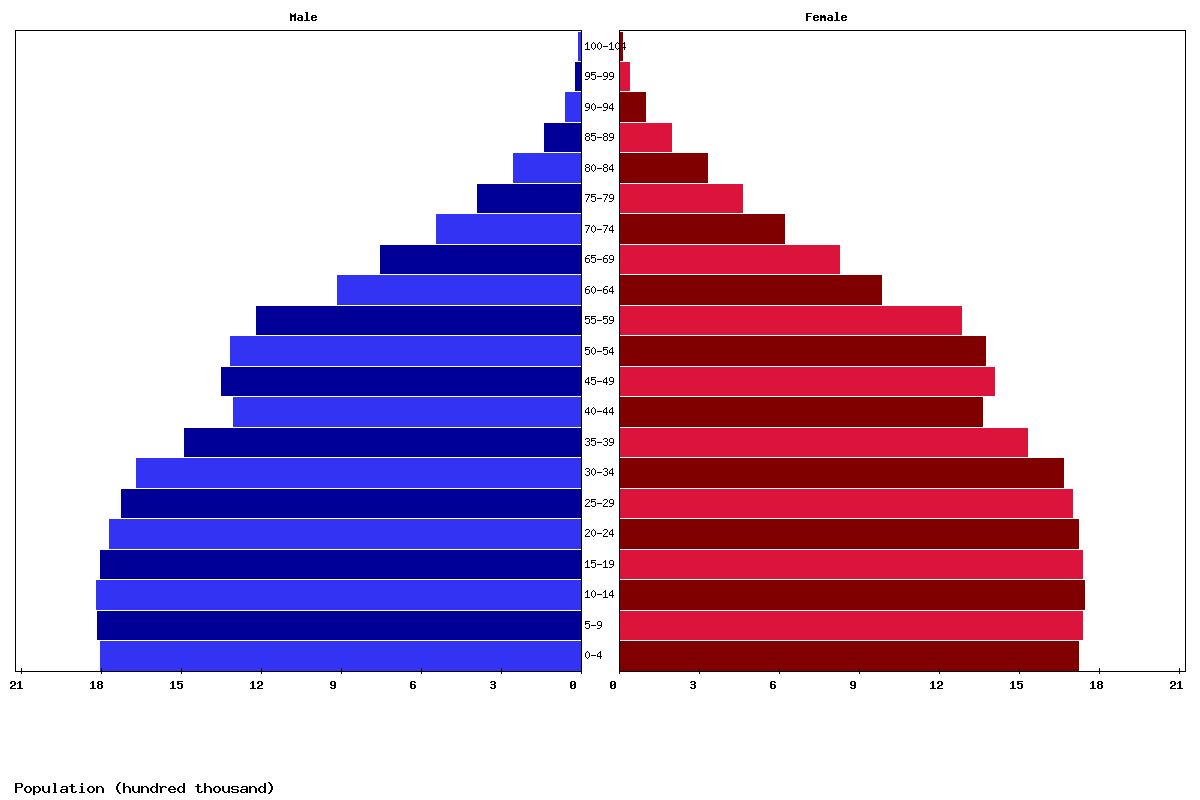
| Age | Both Sexes Population | Male Population | Female Population | Both Sexes (%) | Male (%) | Female (%) | Sex ratio (female/male) |
|---|---|---|---|---|---|---|---|
| Total | 44,552,008 | 22,053,260 | 22,498,748 | 100 | 100 | 100 | 98 |
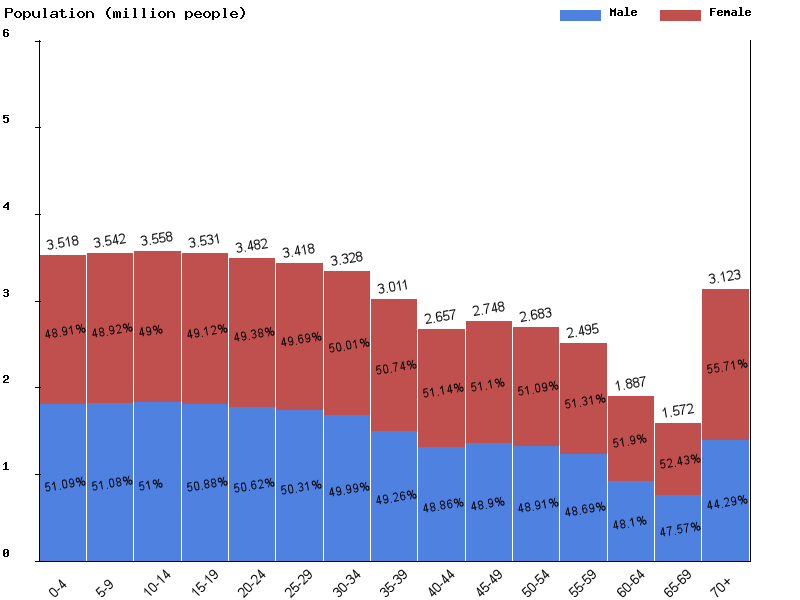
| 00-04 | 3,517,705 | 1,797,043 | 1,720,662 | 7.9 | 8.1 | 7.6 | 104.4 |
| 05-09 | 3,541,780 | 1,809,016 | 1,732,764 | 7.9 | 8.2 | 7.7 | 104.4 |
| 10-14 | 3,558,310 | 1,814,611 | 1,743,699 | 8 | 8.2 | 7.8 | 104.1 |
| 15-19 | 3,530,792 | 1,796,493 | 1,734,299 | 7.9 | 8.1 | 7.7 | 103.6 |
| 20-24 | 3,482,234 | 1,762,656 | 1,719,578 | 7.8 | 8 | 7.6 | 102.5 |
| 25-29 | 3,417,870 | 1,719,402 | 1,698,468 | 7.7 | 7.8 | 7.5 | 101.2 |
| 30-34 | 3,327,730 | 1,663,450 | 1,664,280 | 7.5 | 7.5 | 7.4 | 100 |
| 35-39 | 3,010,508 | 1,482,997 | 1,527,511 | 6.8 | 6.7 | 6.8 | 97.1 |
| 40-44 | 2,657,289 | 1,298,426 | 1,358,863 | 6 | 5.9 | 6 | 95.6 |
| 45-49 | 2,747,905 | 1,343,613 | 1,404,292 | 6.2 | 6.1 | 6.2 | 95.7 |
| 50-54 | 2,683,487 | 1,312,486 | 1,371,001 | 6 | 6 | 6.1 | 95.7 |
| 55-59 | 2,494,536 | 1,214,531 | 1,280,005 | 5.6 | 5.5 | 5.7 | 94.9 |
| 60-64 | 1,887,073 | 907,709 | 979,364 | 4.2 | 4.1 | 4.4 | 92.7 |
| 65-69 | 1,571,780 | 747,747 | 824,033 | 3.5 | 3.4 | 3.7 | 90.7 |
| 70-74 | 1,154,837 | 538,707 | 616,130 | 2.6 | 2.4 | 2.7 | 87.4 |
| 75-79 | 845,215 | 384,375 | 460,840 | 1.9 | 1.7 | 2 | 83.4 |
| 80-84 | 579,265 | 250,567 | 328,698 | 1.3 | 1.1 | 1.5 | 76.2 |
| 85-89 | 326,587 | 132,029 | 194,558 | 0.7 | 0.6 | 0.9 | 67.9 |
| 90-94 | 151,627 | 56,139 | 95,488 | 0.3 | 0.3 | 0.4 | 58.8 |
| 95-99 | 52,570 | 17,223 | 35,347 | 0.1 | 0.1 | 0.2 | 48.7 |
| 100+ | 12,908 | 4,040 | 8,868 | 0 | 0 | 0 | 45.6 |
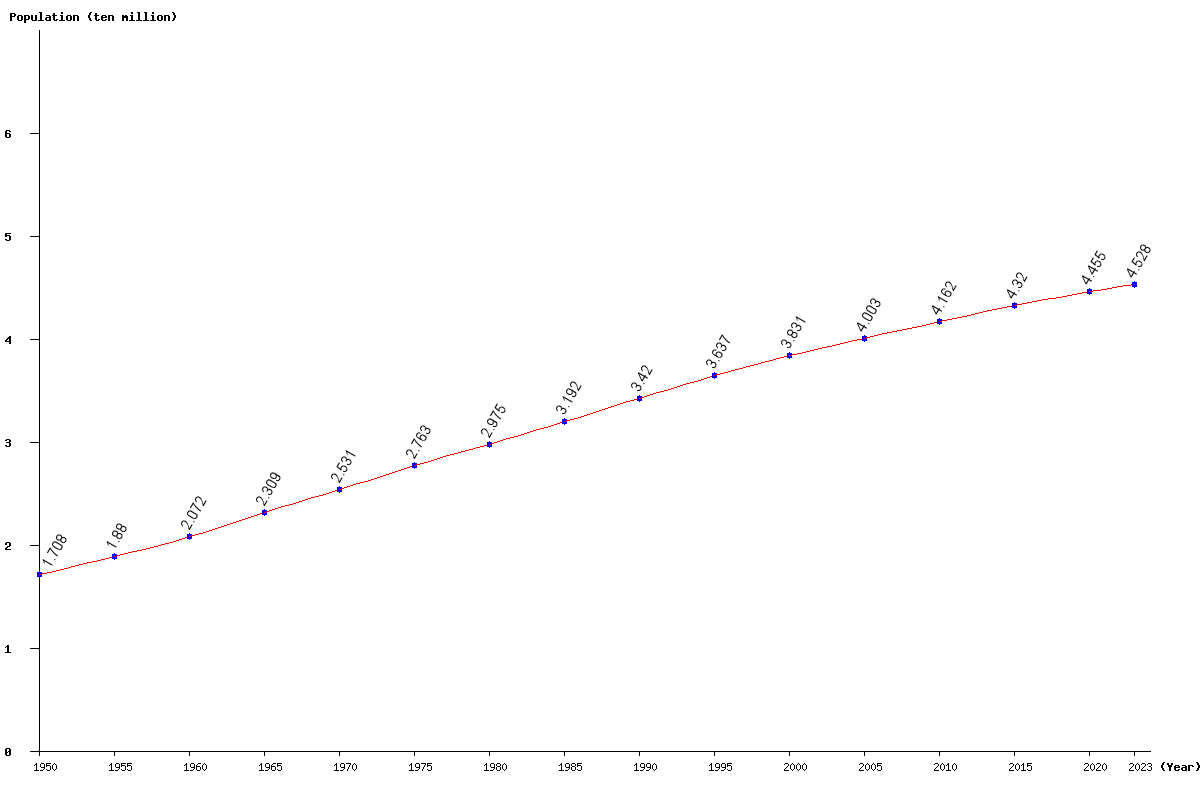
| Year | Population | Yearly % Change |
Yearly Change |
Sex ratio | Density (P/Km²) |
|---|---|---|---|---|---|
| 2023 | 45,280,643 | 0.52 | 236,084 | 97.91 | 200.36 |
| 2022 | 45,044,559 | 0.54 | 243,044 | 97.94 | 199.32 |
| 2021 | 44,801,515 | 0.56 | 249,507 | 97.98 | 198.24 |
| 2020 | 44,552,008 | 0.58 | 255,126 | 98.02 | 197.14 |
| 2019 | 44,296,882 | 0.59 | 260,905 | 98.06 | 196.01 |
| 2018 | 44,035,977 | 0.61 | 268,432 | 98.10 | 194.85 |
| 2017 | 43,767,545 | 0.64 | 278,412 | 98.14 | 193.67 |
| 2016 | 43,489,133 | 0.67 | 289,836 | 98.18 | 192.43 |
| 2015 | 43,199,297 | 0.70 | 302,192 | 98.22 | 191.15 |
| 2014 | 42,897,105 | 0.74 | 313,116 | 98.25 | 189.81 |
| 2013 | 42,583,989 | 0.76 | 320,266 | 98.28 | 188.43 |
| 2012 | 42,263,723 | 0.77 | 322,260 | 98.30 | 187.01 |
| 2011 | 41,941,463 | 0.77 | 320,564 | 98.32 | 185.58 |
| 2010 | 41,620,899 | 0.77 | 317,679 | 98.33 | 184.17 |
| 2005 | 40,028,199 | 4.47 | 1,714,379 | 98.37 | 177.12 |
| 2000 | 38,313,820 | 5.33 | 1,938,899 | 98.53 | 169.53 |
| 1995 | 36,374,921 | 6.37 | 2,177,326 | 98.81 | 160.95 |
| 1990 | 34,197,595 | 7.14 | 2,277,996 | 98.99 | 151.32 |
| 1985 | 31,919,599 | 7.30 | 2,171,387 | 99.26 | 141.24 |
| 1980 | 29,748,212 | 7.67 | 2,119,534 | 99.36 | 131.63 |
| 1975 | 27,628,678 | 9.18 | 2,323,117 | 99.43 | 122.25 |
| 1970 | 25,305,561 | 9.60 | 2,217,437 | 99.70 | 111.97 |
| 1965 | 23,088,124 | 11.41 | 2,363,692 | 99.28 | 102.16 |
| 1960 | 20,724,432 | 10.25 | 1,926,609 | 99.73 | 91.70 |
| 1955 | 18,797,823 | 10.09 | 1,722,169 | 100.33 | 83.18 |
| 1950 | 17,075,654 | 100.69 | 75.56 |