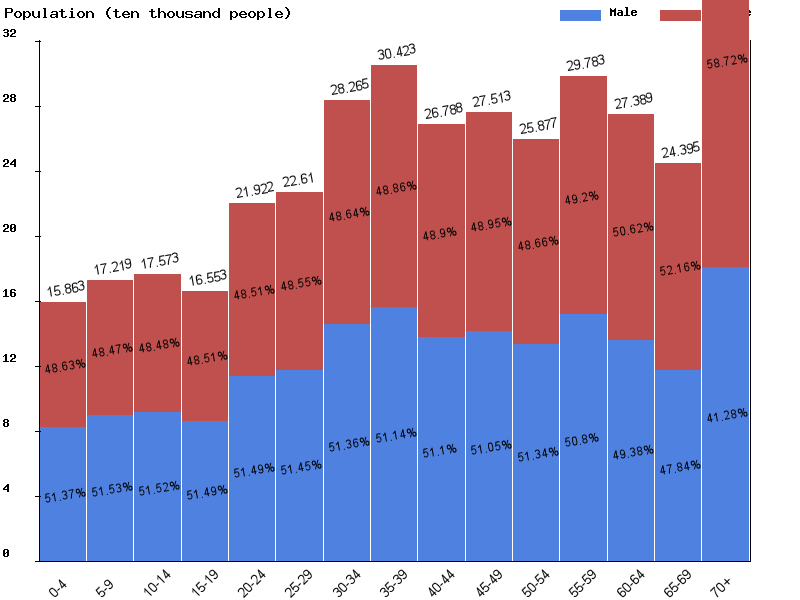
Bosnia and Herzegovina population
3,825,424
Births this year: 291,906
Births today 9
Deaths this year 328,394
Deaths today 10
3,825,424
| Region Name | Percents | Number |
|---|---|---|
| Muslim | 40% | 1,544,765 people |
| Orthodox | 31% | 1,197,193 people |
| Roman Catholic | 15% | 579,287 people |
| other | 14% | 540,668 people |
| Ethnic groups Name | Percents | Number |
|---|---|---|
| Bosniak | 48% | 1,853,718 people |
| Serb | 37.1% | 1,432,769 people |
| Croat | 14.3% | 552,253 people |
| other | 0.6% | 23,171 people |
| Age | Both Sexes Population | Male Population | Female Population | Both Sexes (%) | Male (%) | Female (%) | Sex ratio (female/male) |
|---|---|---|---|---|---|---|---|
| Total | 3,680,513 | 1,829,538 | 1,850,975 | 100 | 100 | 100 | 98.8 |
| 00-04 | 142,638 | 73,027 | 69,611 | 3.9 | 4 | 3.8 | 104.9 |
| 05-09 | 158,359 | 81,341 | 77,018 | 4.3 | 4.4 | 4.2 | 105.6 |
| 10-14 | 171,985 | 88,619 | 83,366 | 4.7 | 4.8 | 4.5 | 106.3 |
| 15-19 | 175,377 | 90,326 | 85,051 | 4.8 | 4.9 | 4.6 | 106.2 |
| 20-24 | 164,854 | 84,855 | 79,999 | 4.5 | 4.6 | 4.3 | 106.1 |
| 25-29 | 218,231 | 112,292 | 105,939 | 5.9 | 6.1 | 5.7 | 106 |
| 30-34 | 225,053 | 115,691 | 109,362 | 6.1 | 6.3 | 5.9 | 105.8 |
| 35-39 | 281,250 | 144,272 | 136,978 | 7.6 | 7.9 | 7.4 | 105.3 |
| 40-44 | 302,176 | 154,213 | 147,963 | 8.2 | 8.4 | 8 | 104.2 |
| 45-49 | 265,051 | 135,010 | 130,041 | 7.2 | 7.4 | 7 | 103.8 |
| 50-54 | 270,409 | 137,288 | 133,121 | 7.3 | 7.5 | 7.2 | 103.1 |
| 55-59 | 251,549 | 128,024 | 123,525 | 6.8 | 7 | 6.7 | 103.6 |
| 60-64 | 284,578 | 142,614 | 141,964 | 7.7 | 7.8 | 7.7 | 100.5 |
| 65-69 | 254,505 | 123,180 | 131,325 | 6.9 | 6.7 | 7.1 | 93.8 |
| 70-74 | 216,166 | 100,430 | 115,736 | 5.9 | 5.5 | 6.3 | 86.8 |
| 75-79 | 150,068 | 65,045 | 85,023 | 4.1 | 3.6 | 4.6 | 76.5 |
| 80-84 | 70,025 | 27,129 | 42,896 | 1.9 | 1.5 | 2.3 | 63.2 |
| 85-89 | 53,369 | 18,879 | 34,490 | 1.5 | 1 | 1.9 | 54.7 |
| 90-94 | 20,002 | 6,069 | 13,933 | 0.5 | 0.3 | 0.8 | 43.6 |
| 95-99 | 4,388 | 1,147 | 3,241 | 0.1 | 0.1 | 0.2 | 35.4 |
| 100+ | 480 | 87 | 393 | 0 | 0 | 0 | 22.1 |


| Year | Population | Yearly % Change |
Yearly Change |
Sex ratio | Density (P/Km²) |
|---|---|---|---|---|---|
| 2024 | 3,697,710 | -0.44 | -16,454 | 98.88 | 72.50 |
| 2023 | 3,714,164 | -0.42 | -15,628 | 98.91 | 72.83 |
| 2022 | 3,729,792 | -0.39 | -14,690 | 98.94 | 73.13 |
| 2021 | 3,744,482 | -0.36 | -13,665 | 98.96 | 73.42 |
| 2020 | 3,758,147 | -0.33 | -12,606 | 98.99 | 73.69 |
| 2019 | 3,770,753 | -0.31 | -11,544 | 99.01 | 73.94 |
| 2018 | 3,782,297 | -0.28 | -10,462 | 99.03 | 74.16 |
| 2017 | 3,792,759 | -0.25 | -9,375 | 99.05 | 74.37 |
| 2016 | 3,802,134 | -0.22 | -8,282 | 99.07 | 74.55 |
| 2015 | 3,810,416 | -0.19 | -7,138 | 99.08 | 74.71 |
| 2014 | 3,817,554 | -0.16 | -5,979 | 99.10 | 74.85 |
| 2013 | 3,823,533 | -0.13 | -4,886 | 99.12 | 74.97 |
| 2012 | 3,828,419 | -0.10 | -3,891 | 99.14 | 75.07 |
| 2011 | 3,832,310 | -0.08 | -2,948 | 99.16 | 75.14 |
| 2010 | 3,835,258 | -0.06 | -2,474 | 99.17 | 75.20 |
| 2005 | 3,833,377 | 1.07 | 40,499 | 99.27 | 75.16 |
| 2000 | 3,792,878 | -2.23 | -86,400 | 99.40 | 74.37 |
| 1995 | 3,879,278 | -14.31 | -647,718 | 99.32 | 76.06 |
| 1990 | 4,526,996 | 3.60 | 157,469 | 99.90 | 88.76 |
| 1985 | 4,369,527 | 5.42 | 224,801 | 98.64 | 85.68 |
| 1980 | 4,144,726 | 4.36 | 173,118 | 98.38 | 81.27 |
| 1975 | 3,971,608 | 6.03 | 225,971 | 98.15 | 77.87 |
| 1970 | 3,745,637 | 6.27 | 221,041 | 97.72 | 73.44 |
| 1965 | 3,524,596 | 9.65 | 310,076 | 97.18 | 69.11 |
| 1960 | 3,214,520 | 9.64 | 282,671 | 96.26 | 63.03 |
| 1955 | 2,931,849 | 10.17 | 270,556 | 95.10 | 57.49 |
| 1950 | 2,661,293 | 93.31 | 52.18 |
