Bermuda population
72,574
Births this year: 7,936
Births today 0
Deaths this year 5,899
Deaths today 0
72,574
| Region Name | Percents | Number |
|---|---|---|
| Protestant (Anglican, African Methodist Episcopal, Seventh Day Adventist , Pentecostal, Methodist, Presbyterian, Church of God, Baptist, Salvation Army, Bretheren, other Protestant ) | 46.1% | 32,518 people |
| Roman Catholic | 14.5% | 10,228 people |
| other | 39.4% | 27,792 people |
| Ethnic groups Name | Percents | Number |
|---|---|---|
| black | 53.8% | 37,949 people |
| white | 31% | 21,866 people |
| mixed | 7.5% | 5,290 people |
| other | 7.1% | 5,008 people |
| unspecified | 0.6% | 423 people |
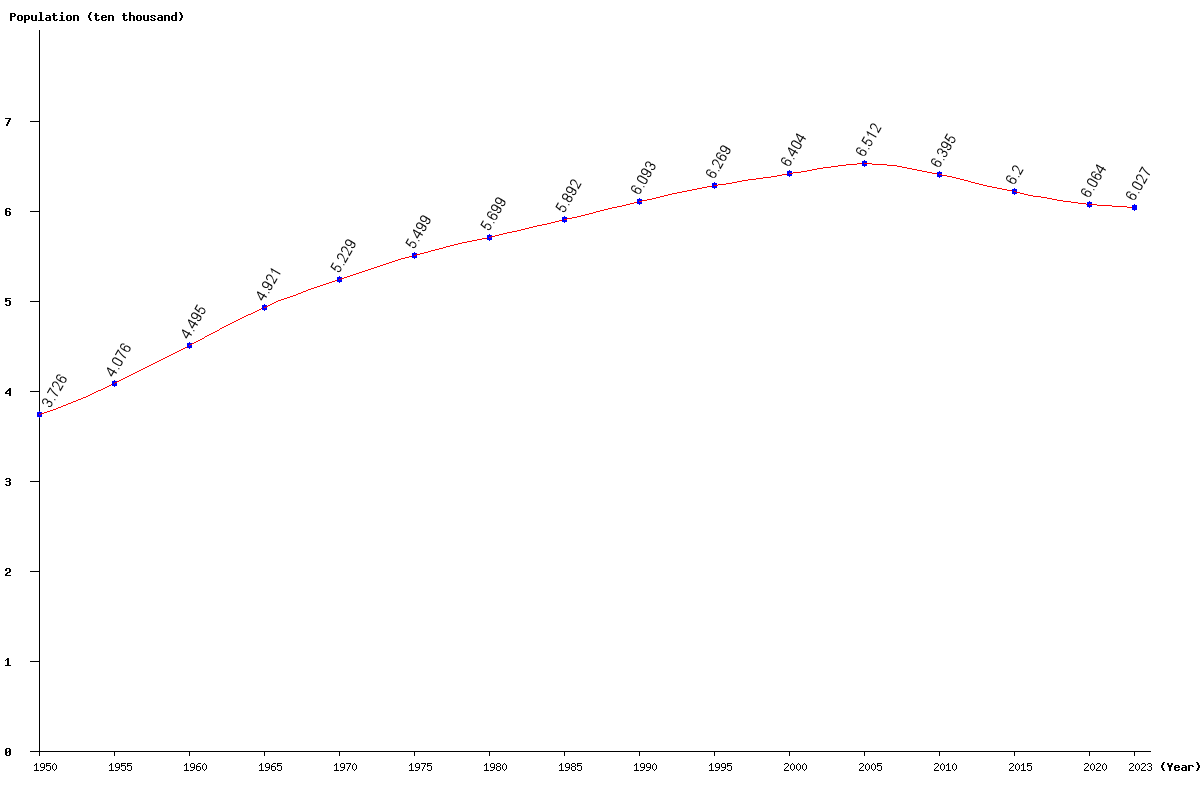
| Year | Population | Yearly % Change |
Yearly Change |
Sex ratio | Density (P/Km²) |
|---|---|---|---|---|---|
| 2025 | 60,069 | -0.17 | -105 | 97.59 | 1,201.38 |
| 2024 | 60,174 | -0.15 | -93 | 97.62 | 1,203.48 |
| 2023 | 60,267 | -0.16 | -98 | 97.65 | 1,205.34 |
| 2022 | 60,365 | -0.20 | -120 | 97.68 | 1,207.30 |
| 2021 | 60,485 | -0.26 | -159 | 97.71 | 1,209.70 |
| 2020 | 60,644 | -0.33 | -199 | 97.74 | 1,212.88 |
| 2019 | 60,843 | -0.38 | -235 | 97.77 | 1,216.86 |
| 2018 | 61,078 | -0.45 | -274 | 97.80 | 1,221.56 |
| 2017 | 61,352 | -0.50 | -310 | 97.82 | 1,227.04 |
| 2016 | 61,662 | -0.55 | -342 | 97.84 | 1,233.24 |
| 2015 | 62,004 | -0.60 | -372 | 97.85 | 1,240.08 |
| 2014 | 62,376 | -0.63 | -397 | 97.85 | 1,247.52 |
| 2013 | 62,773 | -0.64 | -406 | 97.83 | 1,255.46 |
| 2012 | 63,179 | -0.63 | -399 | 97.81 | 1,263.58 |
| 2011 | 63,578 | -0.59 | -376 | 97.78 | 1,271.56 |
| 2010 | 63,954 | -0.55 | -352 | 97.76 | 1,279.08 |
| 2005 | 65,124 | 1.70 | 1,089 | 97.67 | 1,302.48 |
| 2000 | 64,035 | 2.14 | 1,341 | 97.54 | 1,280.70 |
| 1995 | 62,694 | 2.89 | 1,763 | 97.38 | 1,253.88 |
| 1990 | 60,931 | 3.41 | 2,008 | 97.21 | 1,218.62 |
| 1985 | 58,923 | 3.39 | 1,933 | 96.92 | 1,178.46 |
| 1980 | 56,990 | 3.63 | 1,996 | 96.74 | 1,139.80 |
| 1975 | 54,994 | 5.18 | 2,708 | 96.72 | 1,099.88 |
| 1970 | 52,286 | 6.25 | 3,075 | 96.94 | 1,045.72 |
| 1965 | 49,211 | 9.48 | 4,263 | 96.78 | 984.22 |
| 1960 | 44,948 | 10.28 | 4,190 | 96.38 | 898.96 |
| 1955 | 40,758 | 9.39 | 3,498 | 95.84 | 815.16 |
| 1950 | 37,260 | 95.30 | 745.20 |