Australia and New Zealand population
0
Births this year: 0
Births today 0
Deaths this year 0
Deaths today 0
0
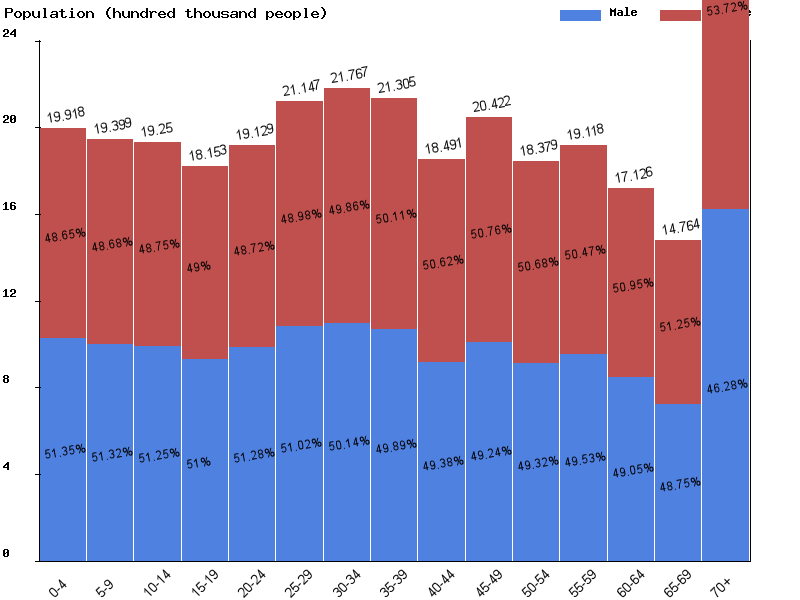
| Age | Both Sexes Population | Male Population | Female Population | Both Sexes (%) | Male (%) | Female (%) | Sex ratio (female/male) |
|---|---|---|---|---|---|---|---|
| Total | 32,007,136 | 15,919,646 | 16,087,490 | 100 | 100 | 100 | 99 |
| 00-04 | 2,001,783 | 1,028,024 | 973,759 | 6.3 | 6.5 | 6.1 | 105.6 |
| 05-09 | 2,067,424 | 1,061,045 | 1,006,379 | 6.5 | 6.7 | 6.3 | 105.4 |
| 10-14 | 2,021,036 | 1,035,087 | 985,949 | 6.3 | 6.5 | 6.1 | 105 |
| 15-19 | 2,019,783 | 1,030,824 | 988,959 | 6.3 | 6.5 | 6.1 | 104.2 |
| 20-24 | 1,919,296 | 972,338 | 946,958 | 6 | 6.1 | 5.9 | 102.7 |
| 25-29 | 2,013,340 | 1,024,706 | 988,634 | 6.3 | 6.4 | 6.1 | 103.6 |
| 30-34 | 2,202,825 | 1,118,181 | 1,084,644 | 6.9 | 7 | 6.7 | 103.1 |
| 35-39 | 2,244,130 | 1,122,436 | 1,121,694 | 7 | 7.1 | 7 | 100.1 |
| 40-44 | 2,170,263 | 1,081,475 | 1,088,788 | 6.8 | 6.8 | 6.8 | 99.3 |
| 45-49 | 1,863,718 | 919,444 | 944,274 | 5.8 | 5.8 | 5.9 | 97.4 |
| 50-54 | 2,032,210 | 999,076 | 1,033,134 | 6.3 | 6.3 | 6.4 | 96.7 |
| 55-59 | 1,817,426 | 893,912 | 923,514 | 5.7 | 5.6 | 5.7 | 96.8 |
| 60-64 | 1,874,717 | 924,549 | 950,168 | 5.9 | 5.8 | 5.9 | 97.3 |
| 65-69 | 1,659,293 | 808,154 | 851,139 | 5.2 | 5.1 | 5.3 | 94.9 |
| 70-74 | 1,398,648 | 673,824 | 724,824 | 4.4 | 4.2 | 4.5 | 93 |
| 75-79 | 1,216,569 | 584,524 | 632,045 | 3.8 | 3.7 | 3.9 | 92.5 |
| 80-84 | 770,376 | 354,773 | 415,603 | 2.4 | 2.2 | 2.6 | 85.4 |
| 85-89 | 442,964 | 190,256 | 252,708 | 1.4 | 1.2 | 1.6 | 75.3 |
| 90-94 | 202,177 | 76,025 | 126,152 | 0.6 | 0.5 | 0.8 | 60.3 |
| 95-99 | 60,799 | 18,949 | 41,850 | 0.2 | 0.1 | 0.3 | 45.3 |
| 100+ | 8,359 | 2,044 | 6,315 | 0 | 0 | 0 | 32.4 |


| Year | Population | Yearly % Change |
Yearly Change |
Sex ratio | Density (P/Km²) |
|---|---|---|---|---|---|
| 2024 | 31,680,301 | 1.05 | 330,501 | 98.98 | 3.99 |
| 2023 | 31,349,800 | 1.08 | 334,982 | 99.01 | 3.95 |
| 2022 | 31,014,818 | 1.11 | 340,580 | 99.03 | 3.90 |
| 2021 | 30,674,238 | 1.14 | 346,997 | 99.05 | 3.86 |
| 2020 | 30,327,241 | 1.18 | 353,782 | 99.06 | 3.82 |
| 2019 | 29,973,459 | 1.22 | 360,380 | 99.08 | 3.77 |
| 2018 | 29,613,079 | 1.25 | 366,546 | 99.09 | 3.73 |
| 2017 | 29,246,533 | 1.29 | 372,018 | 99.10 | 3.68 |
| 2016 | 28,874,515 | 1.32 | 377,016 | 99.12 | 3.63 |
| 2015 | 28,497,499 | 1.35 | 379,664 | 99.17 | 3.59 |
| 2014 | 28,117,835 | 1.38 | 382,094 | 99.23 | 3.54 |
| 2013 | 27,735,741 | 1.42 | 388,483 | 99.31 | 3.49 |
| 2012 | 27,347,258 | 1.49 | 400,404 | 99.40 | 3.44 |
| 2011 | 26,946,854 | 1.56 | 414,964 | 99.46 | 3.39 |
| 2010 | 26,531,890 | 1.66 | 432,076 | 99.47 | 3.34 |
| 2005 | 24,408,981 | 6.29 | 1,443,496 | 98.98 | 3.07 |
| 2000 | 22,965,485 | 5.35 | 1,165,829 | 98.99 | 2.89 |
| 1995 | 21,799,656 | 6.37 | 1,305,253 | 98.71 | 2.74 |
| 1990 | 20,494,403 | 7.53 | 1,435,168 | 99.05 | 2.58 |
| 1985 | 19,059,235 | 6.74 | 1,204,141 | 99.45 | 2.40 |
| 1980 | 17,855,094 | 5.18 | 879,537 | 99.56 | 2.25 |
| 1975 | 16,975,557 | 7.96 | 1,251,249 | 100.40 | 2.14 |
| 1970 | 15,724,308 | 12.35 | 1,728,294 | 100.93 | 1.98 |
| 1965 | 13,996,014 | 10.52 | 1,331,687 | 101.33 | 1.76 |
| 1960 | 12,664,327 | 11.59 | 1,315,503 | 101.91 | 1.59 |
| 1955 | 11,348,824 | 12.53 | 1,263,479 | 102.26 | 1.43 |
| 1950 | 10,085,345 | 101.47 | 1.27 |
