Asia population
0
Births this year: 0
Births today 0
Deaths this year 0
Deaths today 0
0
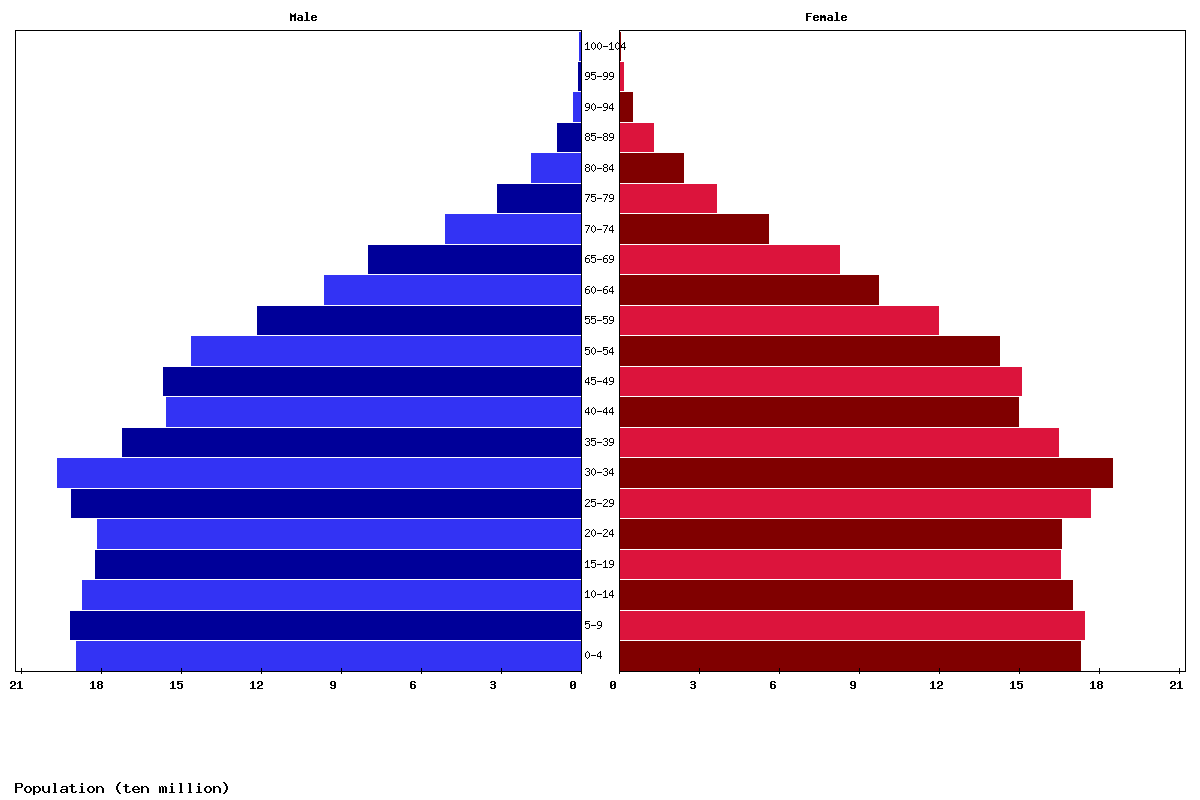
| Age | Both Sexes Population | Male Population | Female Population | Both Sexes (%) | Male (%) | Female (%) | Sex ratio (female/male) |
|---|---|---|---|---|---|---|---|
| Total | 4,774,708,304 | 2,438,668,079 | 2,336,040,225 | 100 | 100 | 100 | 104.4 |
| 00-04 | 346,249,120 | 180,408,873 | 165,840,247 | 7.3 | 7.4 | 7.1 | 108.8 |
| 05-09 | 359,491,986 | 187,712,777 | 171,779,209 | 7.5 | 7.7 | 7.4 | 109.3 |
| 10-14 | 363,666,059 | 190,218,867 | 173,447,192 | 7.6 | 7.8 | 7.4 | 109.7 |
| 15-19 | 354,220,279 | 185,509,772 | 168,710,507 | 7.4 | 7.6 | 7.2 | 110 |
| 20-24 | 344,442,641 | 180,520,122 | 163,922,519 | 7.2 | 7.4 | 7 | 110.1 |
| 25-29 | 343,919,099 | 179,705,424 | 164,213,675 | 7.2 | 7.4 | 7 | 109.4 |
| 30-34 | 364,579,639 | 189,290,073 | 175,289,566 | 7.6 | 7.8 | 7.5 | 108 |
| 35-39 | 376,969,720 | 193,491,021 | 183,478,699 | 7.9 | 7.9 | 7.9 | 105.5 |
| 40-44 | 331,702,500 | 168,682,504 | 163,019,996 | 6.9 | 6.9 | 7 | 103.5 |
| 45-49 | 299,273,101 | 151,643,321 | 147,629,780 | 6.3 | 6.2 | 6.3 | 102.7 |
| 50-54 | 299,941,769 | 151,950,257 | 147,991,512 | 6.3 | 6.2 | 6.3 | 102.7 |
| 55-59 | 278,630,579 | 139,821,298 | 138,809,281 | 5.8 | 5.7 | 5.9 | 100.7 |
| 60-64 | 227,630,946 | 113,187,995 | 114,442,951 | 4.8 | 4.6 | 4.9 | 98.9 |
| 65-69 | 176,097,927 | 86,192,089 | 89,905,838 | 3.7 | 3.5 | 3.8 | 95.9 |
| 70-74 | 139,770,187 | 66,910,514 | 72,859,673 | 2.9 | 2.7 | 3.1 | 91.8 |
| 75-79 | 84,332,037 | 38,565,068 | 45,766,969 | 1.8 | 1.6 | 2 | 84.3 |
| 80-84 | 47,220,979 | 20,664,258 | 26,556,721 | 1 | 0.8 | 1.1 | 77.8 |
| 85-89 | 24,413,182 | 9,949,983 | 14,463,199 | 0.5 | 0.4 | 0.6 | 68.8 |
| 90-94 | 9,377,856 | 3,400,484 | 5,977,372 | 0.2 | 0.1 | 0.3 | 56.9 |
| 95-99 | 2,387,839 | 741,540 | 1,646,299 | 0.1 | 0 | 0.1 | 45 |
| 100+ | 390,859 | 101,839 | 289,020 | 0 | 0 | 0 | 35.2 |

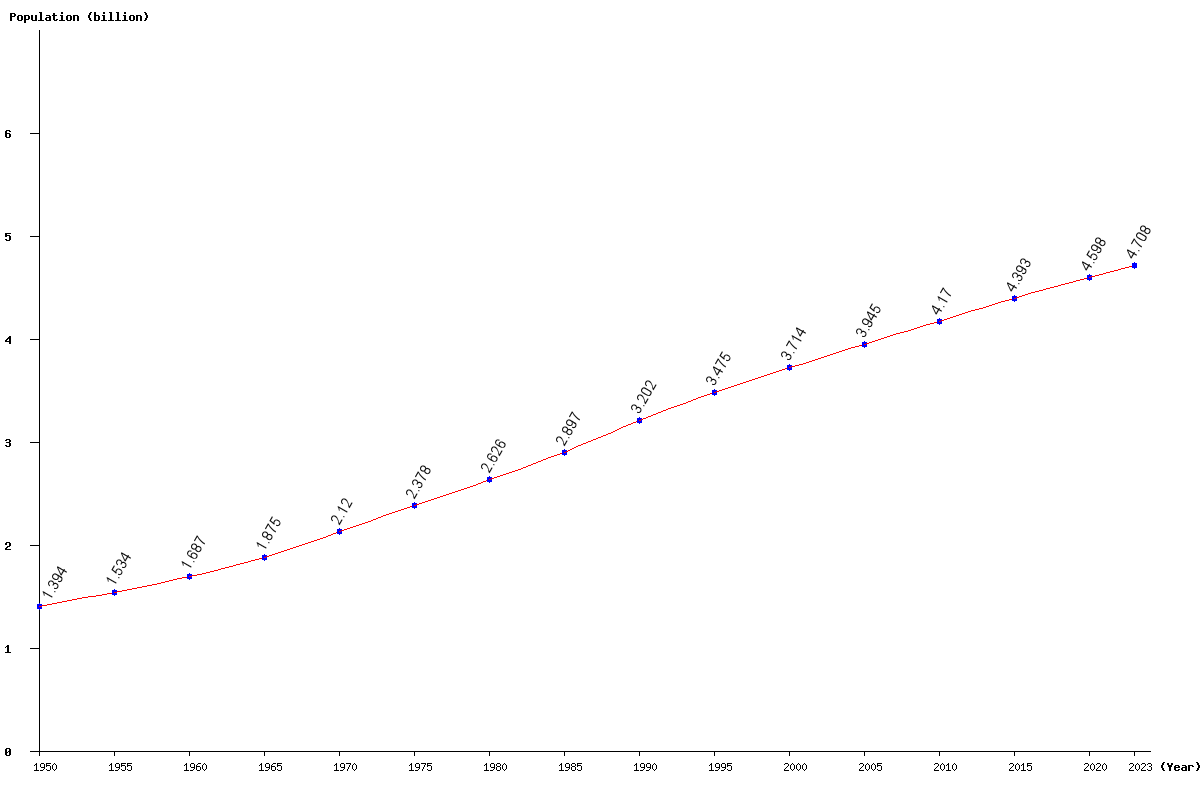
| Year | Population | Yearly % Change |
Yearly Change |
Sex ratio | Density (P/Km²) |
|---|---|---|---|---|---|
| 2024 | 4,741,780,596 | 0.72 | 34,042,079 | 104.44 | 152.80 |
| 2023 | 4,707,738,517 | 0.75 | 35,204,808 | 104.48 | 151.70 |
| 2022 | 4,672,533,709 | 0.79 | 36,428,360 | 104.51 | 150.57 |
| 2021 | 4,636,105,349 | 0.82 | 37,679,089 | 104.55 | 149.39 |
| 2020 | 4,598,426,260 | 0.85 | 38,907,950 | 104.58 | 148.18 |
| 2019 | 4,559,518,310 | 0.89 | 40,066,638 | 104.61 | 146.92 |
| 2018 | 4,519,451,672 | 0.92 | 41,136,508 | 104.64 | 145.63 |
| 2017 | 4,478,315,164 | 0.95 | 42,090,691 | 104.66 | 144.31 |
| 2016 | 4,436,224,473 | 0.98 | 42,928,459 | 104.68 | 142.95 |
| 2015 | 4,393,296,014 | 1.01 | 43,735,493 | 104.69 | 141.57 |
| 2014 | 4,349,560,521 | 1.03 | 44,458,932 | 104.70 | 140.16 |
| 2013 | 4,305,101,589 | 1.06 | 44,948,589 | 104.70 | 138.73 |
| 2012 | 4,260,153,000 | 1.07 | 45,150,970 | 104.70 | 137.28 |
| 2011 | 4,215,002,030 | 1.08 | 45,141,643 | 104.69 | 135.82 |
| 2010 | 4,169,860,387 | 1.09 | 45,028,433 | 104.68 | 134.37 |
| 2005 | 3,944,669,784 | 6.20 | 230,199,952 | 104.51 | 127.11 |
| 2000 | 3,714,469,832 | 6.90 | 239,621,155 | 104.32 | 119.69 |
| 1995 | 3,474,848,677 | 8.51 | 272,373,985 | 104.37 | 111.97 |
| 1990 | 3,202,474,692 | 10.54 | 305,298,028 | 104.27 | 103.20 |
| 1985 | 2,897,176,664 | 10.34 | 271,593,047 | 104.15 | 93.36 |
| 1980 | 2,625,583,617 | 10.41 | 247,517,841 | 104.19 | 84.61 |
| 1975 | 2,378,065,776 | 12.15 | 257,635,761 | 104.17 | 76.63 |
| 1970 | 2,120,430,015 | 13.10 | 245,618,083 | 104.10 | 68.33 |
| 1965 | 1,874,811,932 | 11.15 | 188,114,315 | 104.19 | 60.41 |
| 1960 | 1,686,697,617 | 9.98 | 152,991,168 | 104.28 | 54.35 |
| 1955 | 1,533,706,449 | 10.02 | 139,688,692 | 104.51 | 49.42 |
| 1950 | 1,394,017,757 | 104.79 | 44.92 |