Togo population
758,166
Births this year: 0
Births today 0
Deaths this year 17,527
Deaths today 3
758,166
| Region Name | Percents | Number |
|---|---|---|
| Christian | 29% | 224,951 people |
| Muslim | 20% | 155,139 people |
| indigenous beliefs | 51% | 395,603 people |
| Ethnic groups Name | Percents | Number |
|---|---|---|
| African (largest and most important are Ewe, Mina, and Kabre) | 99% | 767,936 people |
| European and Syrian-Lebanese less than | 1% | 7,757 people |
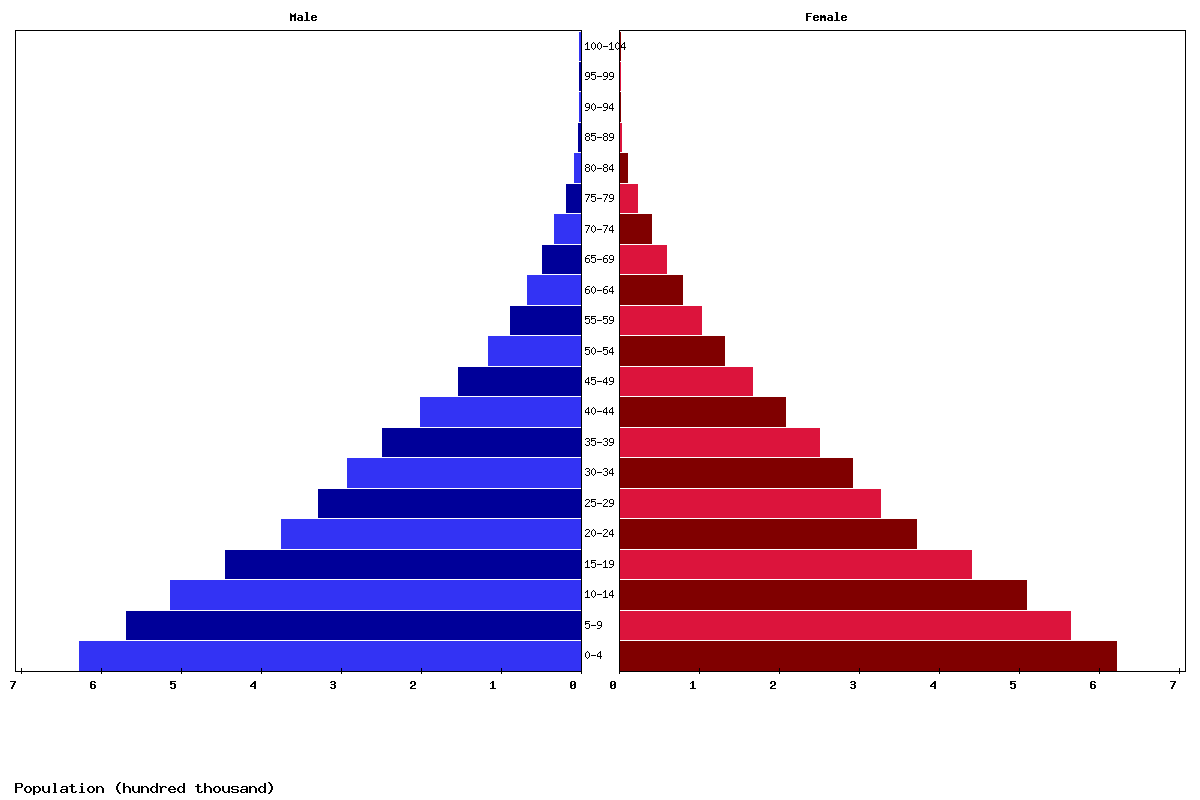
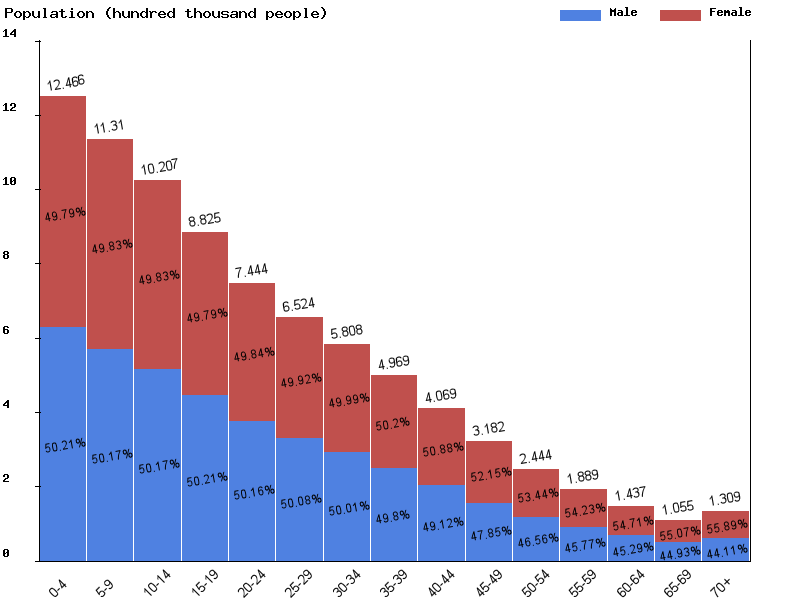
| Age | Both Sexes Population | Male Population | Female Population | Both Sexes (%) | Male (%) | Female (%) | Sex ratio (female/male) |
|---|---|---|---|---|---|---|---|
| Total | 8,293,638 | 4,109,055 | 4,184,583 | 100 | 100 | 100 | 98.2 |
| 00-04 | 1,246,605 | 625,881 | 620,724 | 15 | 15.2 | 14.8 | 100.8 |
| 05-09 | 1,131,035 | 567,459 | 563,576 | 13.6 | 13.8 | 13.5 | 100.7 |
| 10-14 | 1,020,669 | 512,062 | 508,607 | 12.3 | 12.5 | 12.2 | 100.7 |
| 15-19 | 882,454 | 443,058 | 439,396 | 10.6 | 10.8 | 10.5 | 100.8 |
| 20-24 | 744,367 | 373,395 | 370,972 | 9 | 9.1 | 8.9 | 100.7 |
| 25-29 | 652,370 | 326,716 | 325,654 | 7.9 | 8 | 7.8 | 100.3 |
| 30-34 | 580,822 | 290,480 | 290,342 | 7 | 7.1 | 6.9 | 100 |
| 35-39 | 496,857 | 247,440 | 249,417 | 6 | 6 | 6 | 99.2 |
| 40-44 | 406,865 | 199,843 | 207,022 | 4.9 | 4.9 | 4.9 | 96.5 |
| 45-49 | 318,229 | 152,274 | 165,955 | 3.8 | 3.7 | 4 | 91.8 |
| 50-54 | 244,362 | 113,772 | 130,590 | 2.9 | 2.8 | 3.1 | 87.1 |
| 55-59 | 188,869 | 86,444 | 102,425 | 2.3 | 2.1 | 2.4 | 84.4 |
| 60-64 | 143,739 | 65,093 | 78,646 | 1.7 | 1.6 | 1.9 | 82.8 |
| 65-69 | 105,518 | 47,414 | 58,104 | 1.3 | 1.2 | 1.4 | 81.6 |
| 70-74 | 70,607 | 31,447 | 39,160 | 0.9 | 0.8 | 0.9 | 80.3 |
| 75-79 | 39,291 | 17,362 | 21,929 | 0.5 | 0.4 | 0.5 | 79.2 |
| 80-84 | 16,083 | 6,902 | 9,181 | 0.2 | 0.2 | 0.2 | 75.2 |
| 85-89 | 4,229 | 1,757 | 2,472 | 0.1 | 0 | 0.1 | 71.1 |
| 90-94 | 615 | 238 | 377 | 0 | 0 | 0 | 63.1 |
| 95-99 | 49 | 17 | 32 | 0 | 0 | 0 | 53.1 |
| 100+ | 3 | 1 | 2 | 0 | 0 | 0 | 50 |
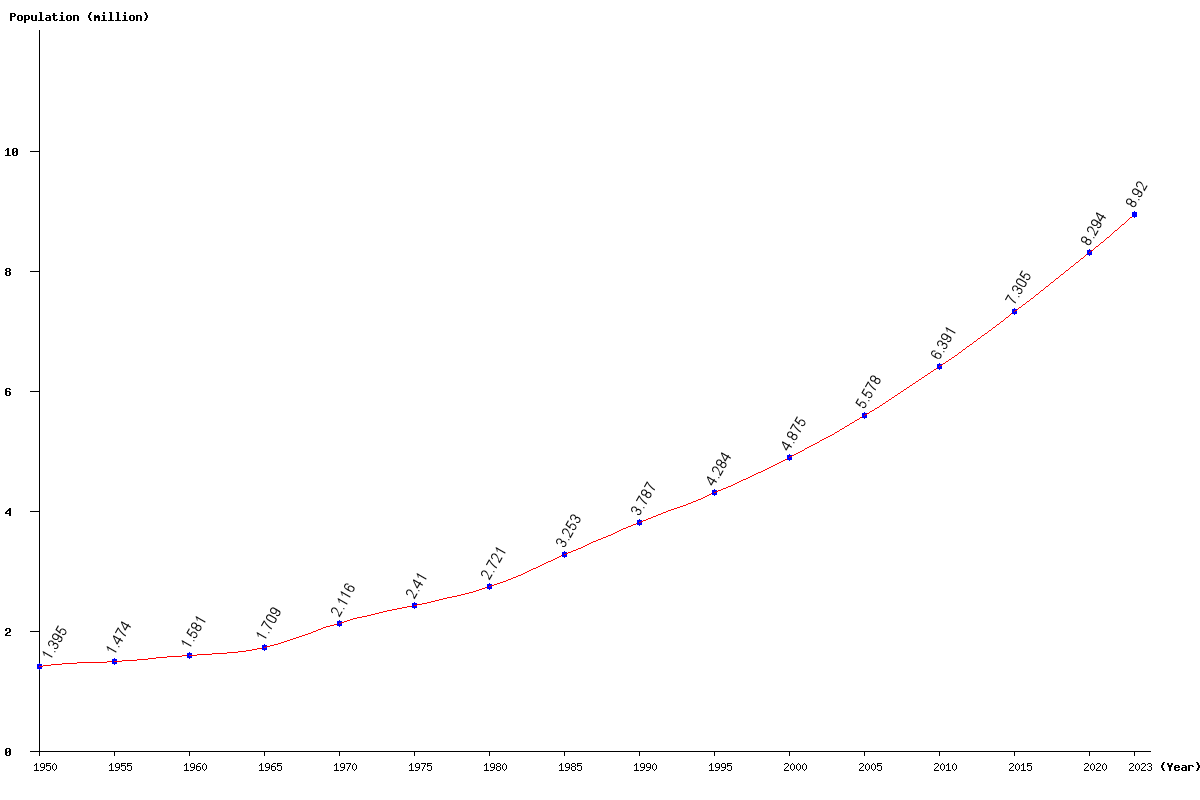
| Year | Population | Yearly % Change |
Yearly Change |
Sex ratio | Density (P/Km²) |
|---|---|---|---|---|---|
| 2023 | 8,919,657 | 2.43 | 211,443 | 98.45 | 163.99 |
| 2022 | 8,708,214 | 2.45 | 208,618 | 98.37 | 160.11 |
| 2021 | 8,499,596 | 2.48 | 205,958 | 98.29 | 156.27 |
| 2020 | 8,293,638 | 2.51 | 203,302 | 98.20 | 152.48 |
| 2019 | 8,090,336 | 2.54 | 200,577 | 98.10 | 148.75 |
| 2018 | 7,889,759 | 2.57 | 197,844 | 97.99 | 145.06 |
| 2017 | 7,691,915 | 2.60 | 195,082 | 97.89 | 141.42 |
| 2016 | 7,496,833 | 2.63 | 192,255 | 97.77 | 137.83 |
| 2015 | 7,304,578 | 2.66 | 189,415 | 97.66 | 134.30 |
| 2014 | 7,115,163 | 2.69 | 186,444 | 97.55 | 130.82 |
| 2013 | 6,928,719 | 2.71 | 183,138 | 97.44 | 127.39 |
| 2012 | 6,745,581 | 2.73 | 179,402 | 97.32 | 124.02 |
| 2011 | 6,566,179 | 2.74 | 175,328 | 97.20 | 120.72 |
| 2010 | 6,390,851 | 2.75 | 171,090 | 97.07 | 117.50 |
| 2005 | 5,578,219 | 14.43 | 703,484 | 96.35 | 102.56 |
| 2000 | 4,874,735 | 13.78 | 590,449 | 95.63 | 89.63 |
| 1995 | 4,284,286 | 13.13 | 497,344 | 95.43 | 78.77 |
| 1990 | 3,786,942 | 16.41 | 533,947 | 97.35 | 69.63 |
| 1985 | 3,252,995 | 19.56 | 532,157 | 97.69 | 59.81 |
| 1980 | 2,720,838 | 12.88 | 310,392 | 97.61 | 50.02 |
| 1975 | 2,410,446 | 13.94 | 294,925 | 97.52 | 44.32 |
| 1970 | 2,115,521 | 23.81 | 406,889 | 97.42 | 38.90 |
| 1965 | 1,708,632 | 8.11 | 128,119 | 97.27 | 31.41 |
| 1960 | 1,580,513 | 7.24 | 106,674 | 97.14 | 29.06 |
| 1955 | 1,473,839 | 5.62 | 78,381 | 97.06 | 27.10 |
| 1950 | 1,395,458 | 97.18 | 25.66 |