Netherlands population
17,303,110
Births this year: 1,485,218
Births today 322
Deaths this year 1,199,075
Deaths today 260
17,303,110
| Region Name | Percents | Number |
|---|---|---|
| Roman Catholic | 28% | 4,764,751 people |
| Protestant (includes Dutch Reformed, Protestant Church of The Netherlands, Calvinist) | 19% | 3,233,224 people |
| other | 11% | 1,871,866 people |
| Ethnic groups Name | Percents | Number |
|---|---|---|
| Dutch | 80.7% | 13,732,692 people |
| EU | 5% | 850,848 people |
| Indonesian | 2.4% | 408,407 people |
| Turkish | 2.2% | 374,373 people |
| Surinamese | 2% | 340,339 people |
| Moroccan | 2% | 340,339 people |
| Caribbean | 0.8% | 136,136 people |
| other | 4.8% | 816,814 people |
| Age | Both Sexes Population | Male Population | Female Population | Both Sexes (%) | Male (%) | Female (%) | Sex ratio (female/male) |
|---|---|---|---|---|---|---|---|
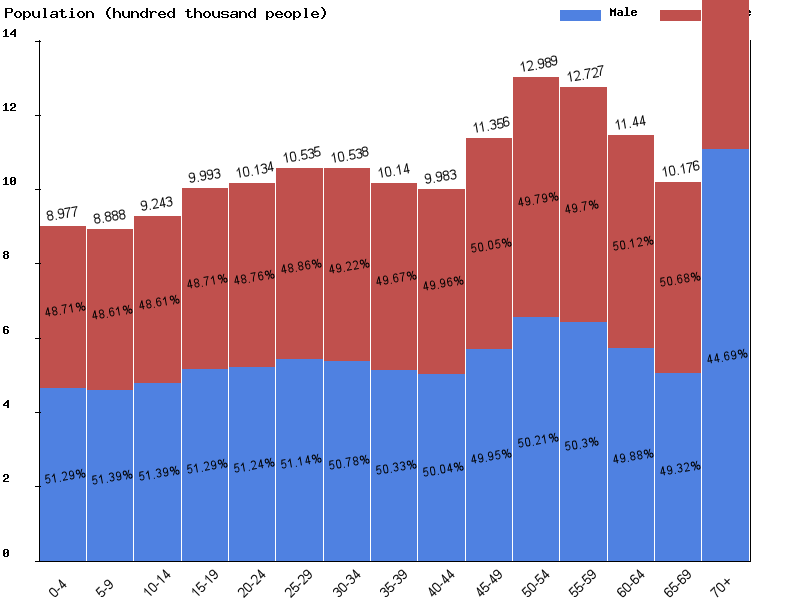
| Total | 17,185,112 | 8,545,238 | 8,639,874 | 100 | 100 | 100 | 98.9 |
| 00-04 | 897,700 | 460,418 | 437,282 | 5.2 | 5.4 | 5.1 | 105.3 |
| 05-09 | 888,842 | 456,781 | 432,061 | 5.2 | 5.3 | 5 | 105.7 |
| 10-14 | 924,313 | 475,023 | 449,290 | 5.4 | 5.6 | 5.2 | 105.7 |
| 15-19 | 999,349 | 512,550 | 486,799 | 5.8 | 6 | 5.6 | 105.3 |
| 20-24 | 1,013,422 | 519,267 | 494,155 | 5.9 | 6.1 | 5.7 | 105.1 |
| 25-29 | 1,053,500 | 538,737 | 514,763 | 6.1 | 6.3 | 6 | 104.7 |
| 30-34 | 1,053,821 | 535,160 | 518,661 | 6.1 | 6.3 | 6 | 103.2 |
| 35-39 | 1,014,004 | 510,383 | 503,621 | 5.9 | 6 | 5.8 | 101.3 |
| 40-44 | 998,349 | 499,609 | 498,740 | 5.8 | 5.8 | 5.8 | 100.2 |
| 45-49 | 1,135,552 | 567,201 | 568,351 | 6.6 | 6.6 | 6.6 | 99.8 |
| 50-54 | 1,298,942 | 652,196 | 646,746 | 7.6 | 7.6 | 7.5 | 100.8 |
| 55-59 | 1,272,749 | 640,234 | 632,515 | 7.4 | 7.5 | 7.3 | 101.2 |
| 60-64 | 1,143,987 | 570,606 | 573,381 | 6.7 | 6.7 | 6.6 | 99.5 |
| 65-69 | 1,017,643 | 501,900 | 515,743 | 5.9 | 5.9 | 6 | 97.3 |
| 70-74 | 981,058 | 476,811 | 504,247 | 5.7 | 5.6 | 5.8 | 94.6 |
| 75-79 | 652,883 | 304,882 | 348,001 | 3.8 | 3.6 | 4 | 87.6 |
| 80-84 | 435,315 | 187,121 | 248,194 | 2.5 | 2.2 | 2.9 | 75.4 |
| 85-89 | 262,709 | 97,591 | 165,118 | 1.5 | 1.1 | 1.9 | 59.1 |
| 90-94 | 109,962 | 32,354 | 77,608 | 0.6 | 0.4 | 0.9 | 41.7 |
| 95-99 | 28,002 | 5,936 | 22,066 | 0.2 | 0.1 | 0.3 | 26.9 |
| 100+ | 3,010 | 478 | 2,532 | 0 | 0 | 0 | 18.9 |


| Year | Population | Yearly % Change |
Yearly Change |
Sex ratio | Density (P/Km²) |
|---|---|---|---|---|---|
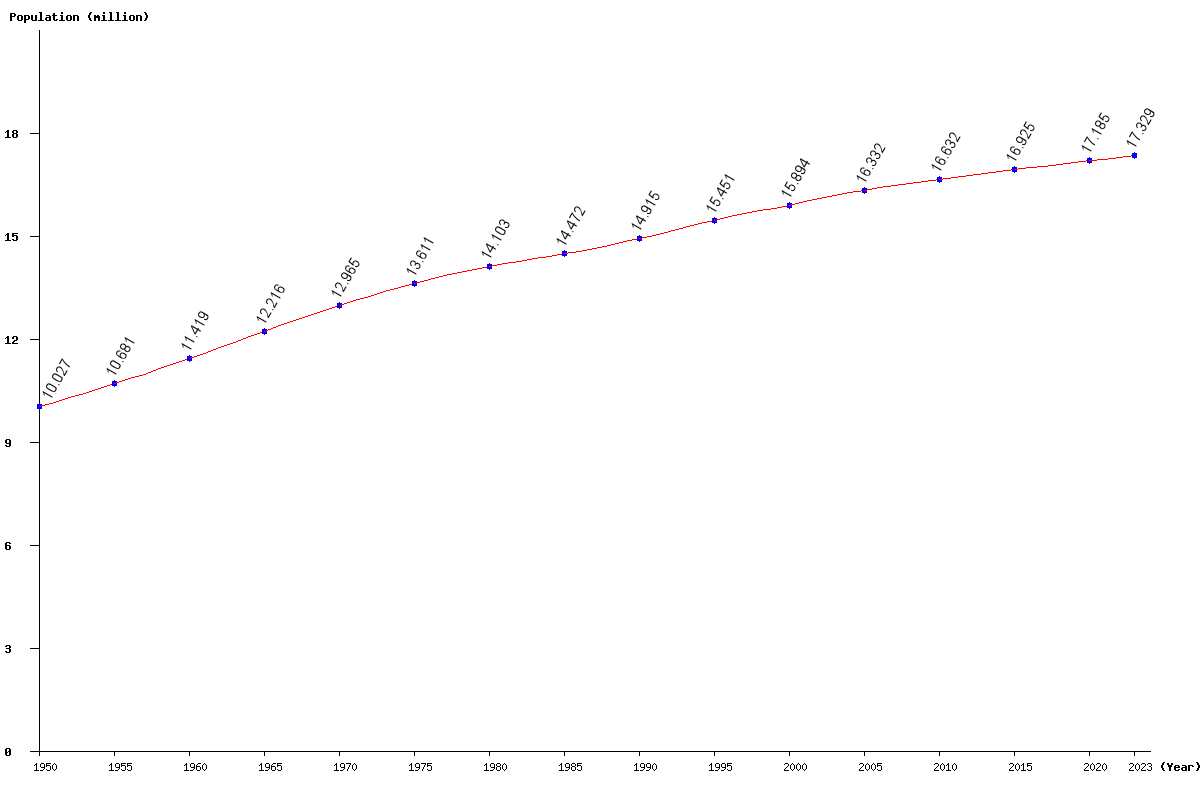
| 2023 | 17,329,333 | 0.27 | 46,938 | 99.07 | 513.92 |
| 2022 | 17,282,395 | 0.28 | 48,141 | 99.02 | 512.53 |
| 2021 | 17,234,254 | 0.29 | 49,142 | 98.96 | 511.10 |
| 2020 | 17,185,112 | 0.29 | 49,914 | 98.90 | 509.64 |
| 2019 | 17,135,198 | 0.30 | 50,667 | 98.84 | 508.16 |
| 2018 | 17,084,531 | 0.30 | 51,686 | 98.78 | 506.66 |
| 2017 | 17,032,845 | 0.31 | 53,116 | 98.71 | 505.13 |
| 2016 | 16,979,729 | 0.32 | 54,800 | 98.63 | 503.55 |
| 2015 | 16,924,929 | 0.34 | 56,909 | 98.55 | 501.93 |
| 2014 | 16,868,020 | 0.35 | 58,863 | 98.45 | 500.24 |
| 2013 | 16,809,157 | 0.36 | 59,839 | 98.35 | 498.49 |
| 2012 | 16,749,318 | 0.36 | 59,455 | 98.25 | 496.72 |
| 2011 | 16,689,863 | 0.35 | 58,292 | 98.16 | 494.95 |
| 2010 | 16,631,571 | 0.34 | 56,398 | 98.08 | 493.23 |
| 2005 | 16,331,646 | 2.75 | 437,630 | 97.94 | 484.33 |
| 2000 | 15,894,016 | 2.87 | 443,213 | 97.93 | 471.35 |
| 1995 | 15,450,803 | 3.59 | 535,664 | 97.89 | 458.21 |
| 1990 | 14,915,139 | 3.06 | 443,548 | 97.72 | 442.32 |
| 1985 | 14,471,591 | 2.61 | 368,312 | 97.92 | 429.17 |
| 1980 | 14,103,279 | 3.62 | 492,215 | 98.58 | 418.25 |
| 1975 | 13,611,064 | 4.98 | 646,184 | 99.19 | 403.65 |
| 1970 | 12,964,880 | 6.13 | 748,758 | 99.58 | 384.49 |
| 1965 | 12,216,122 | 6.98 | 797,470 | 99.49 | 362.28 |
| 1960 | 11,418,652 | 6.91 | 738,020 | 99.22 | 338.63 |
| 1955 | 10,680,632 | 6.52 | 653,585 | 99.28 | 316.74 |
| 1950 | 10,027,047 | 99.40 | 297.36 |